29
/fr/
fr
AIzaSyAYiBZKx7MnpbEhh9jyipgxe19OcubqV5w
April 1, 2024
176454
Lebanon
LBN
true
2
1
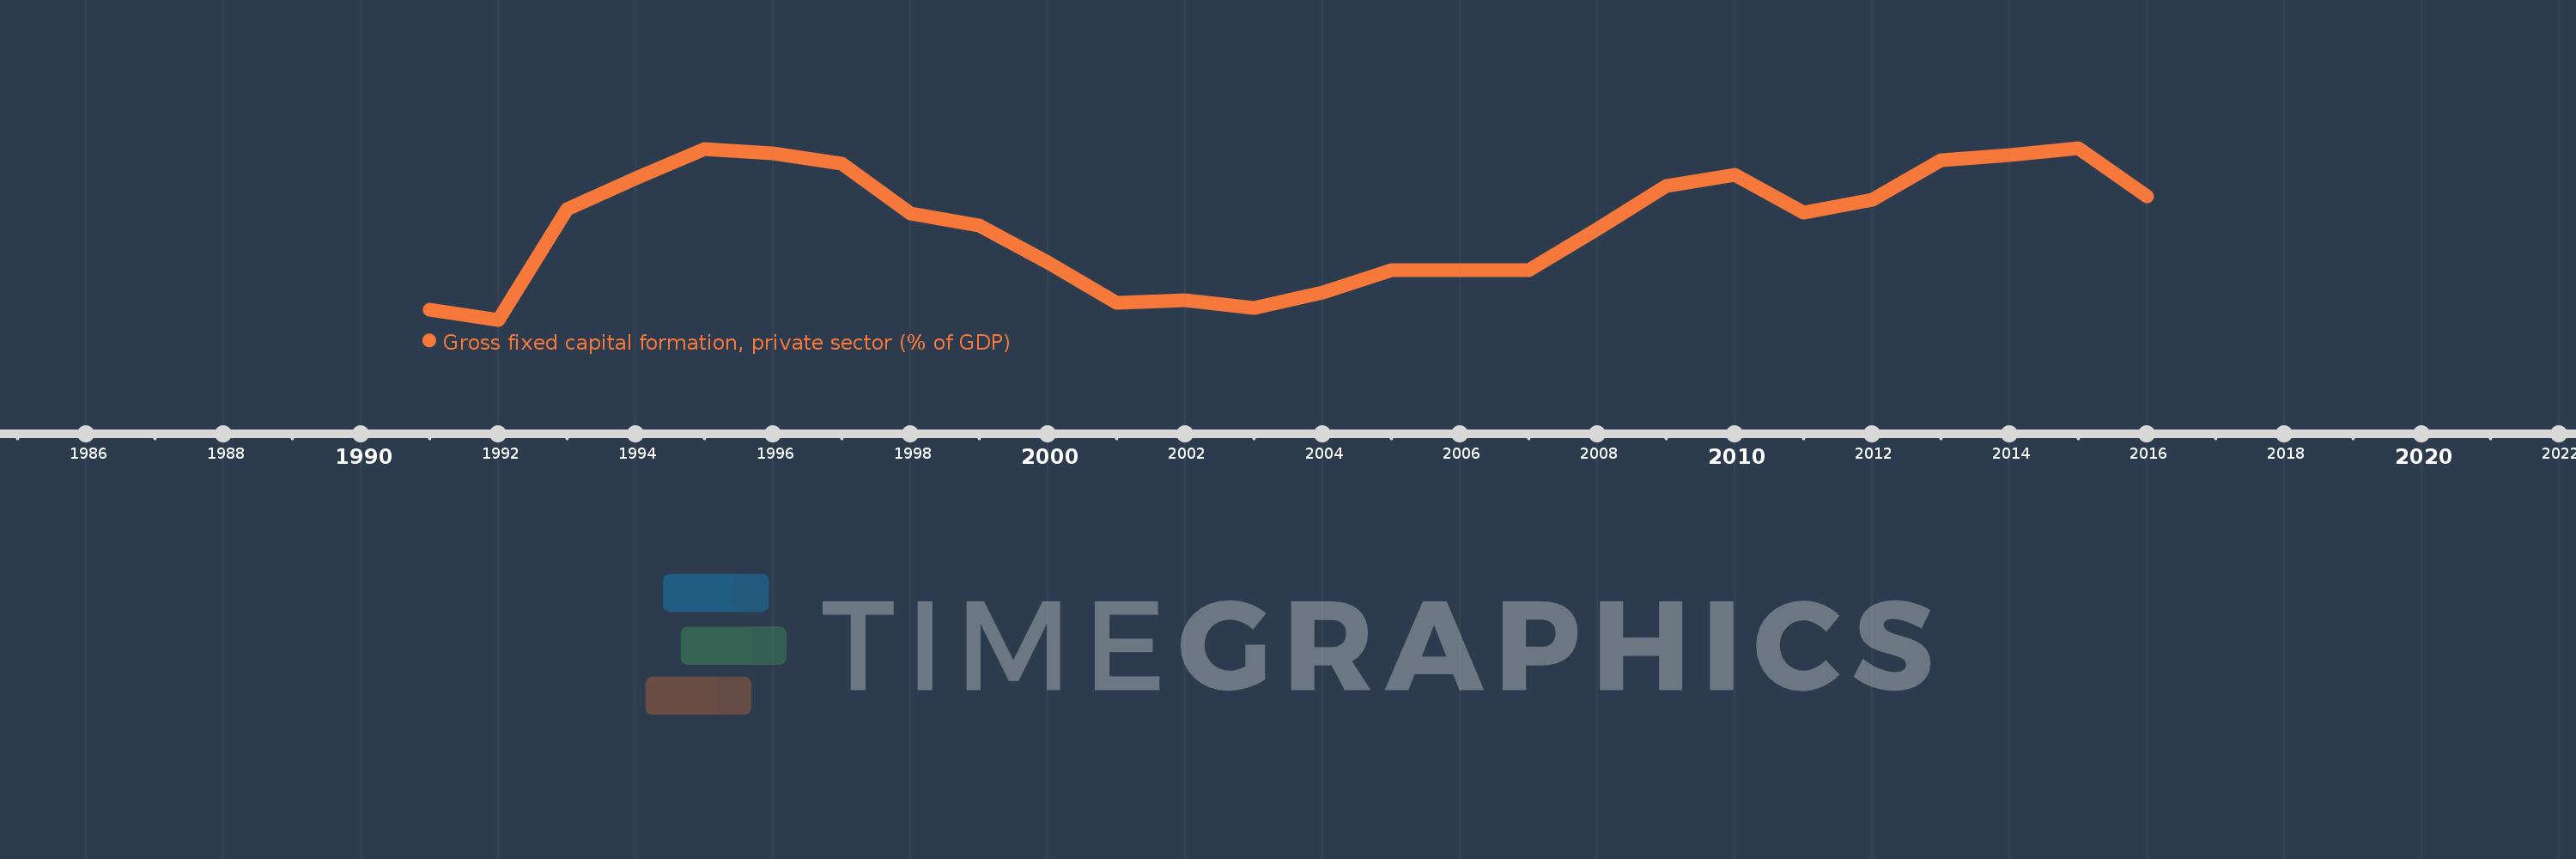
Gross fixed capital formation, private sector (% of GDP)
2016,2015,2014,2013,2012,2011,2010,2009,2008,2007,2006,2005,2004,2003,2002,2001,2000,1999,1998,1997,1996,1995,1994,1993,1992,1991
Cette statistique dans les autres pays:
La ligne de temps
Cette échelle de temps montre un graphique de 1991 année à 2016 année Lebanon. Les données jusqu'à 1990 année ne sont pas présentés. Quantité d'observations actuelles selon dates: 26.
Source (désignation):
Les indicateurs du développement mondiale
Source (organisation):
World Bank national accounts data, and OECD National Accounts data files.
Catégories:
Economy & Growth
Dernière mise à jour
23 avr. 2017
Les indicateurs de changement de valeurs selon les années
Minimum:
15.392
1 janv. 1992
Maximum:
27.91
1 janv. 2015
Pour la date d''observation
Valeur
Changement absolu
Le changement par rapport à la valeur précédente
1 janv. 1991
16.097
+16.097
0.0%
1 janv. 1992
15.392
-0.705
-4.38%
1 janv. 1993
23.463
+8.071
52.44%
1 janv. 1994
25.709
+2.246
9.57%
1 janv. 1995
27.819
+2.11
8.21%
1 janv. 1996
27.498
-0.321
-1.15%
1 janv. 1997
26.753
-0.745
-2.71%
1 janv. 1998
23.151
-3.602
-13.46%
1 janv. 1999
22.249
-0.901
-3.89%
1 janv. 2000
19.54
-2.709
-12.18%
1 janv. 2001
16.595
-2.945
-15.07%
1 janv. 2002
16.789
+0.194
1.17%
1 janv. 2003
16.279
-0.51
-3.04%
1 janv. 2004
17.348
+1.069
6.57%
1 janv. 2005
19.016
+1.668
9.61%
1 janv. 2006
19.015
-0.001
0.0%
1 janv. 2007
19.009
-0.006
-0.03%
1 janv. 2008
22.022
+3.013
15.85%
1 janv. 2009
25.135
+3.114
14.14%
1 janv. 2010
25.955
+0.82
3.26%
1 janv. 2011
23.171
-2.784
-10.73%
1 janv. 2012
24.113
+0.942
4.07%
1 janv. 2013
27.006
+2.892
12.0%
1 janv. 2014
27.403
+0.397
1.47%
1 janv. 2015
27.91
+0.507
1.85%
1 janv. 2016
24.363
-3.546
-12.71%
Classement des pays selon les statistiques actuelles par années


Commentaires: