29
/fr/
fr
AIzaSyAYiBZKx7MnpbEhh9jyipgxe19OcubqV5w
April 1, 2024
215340
Oman
OMN
true
2
1
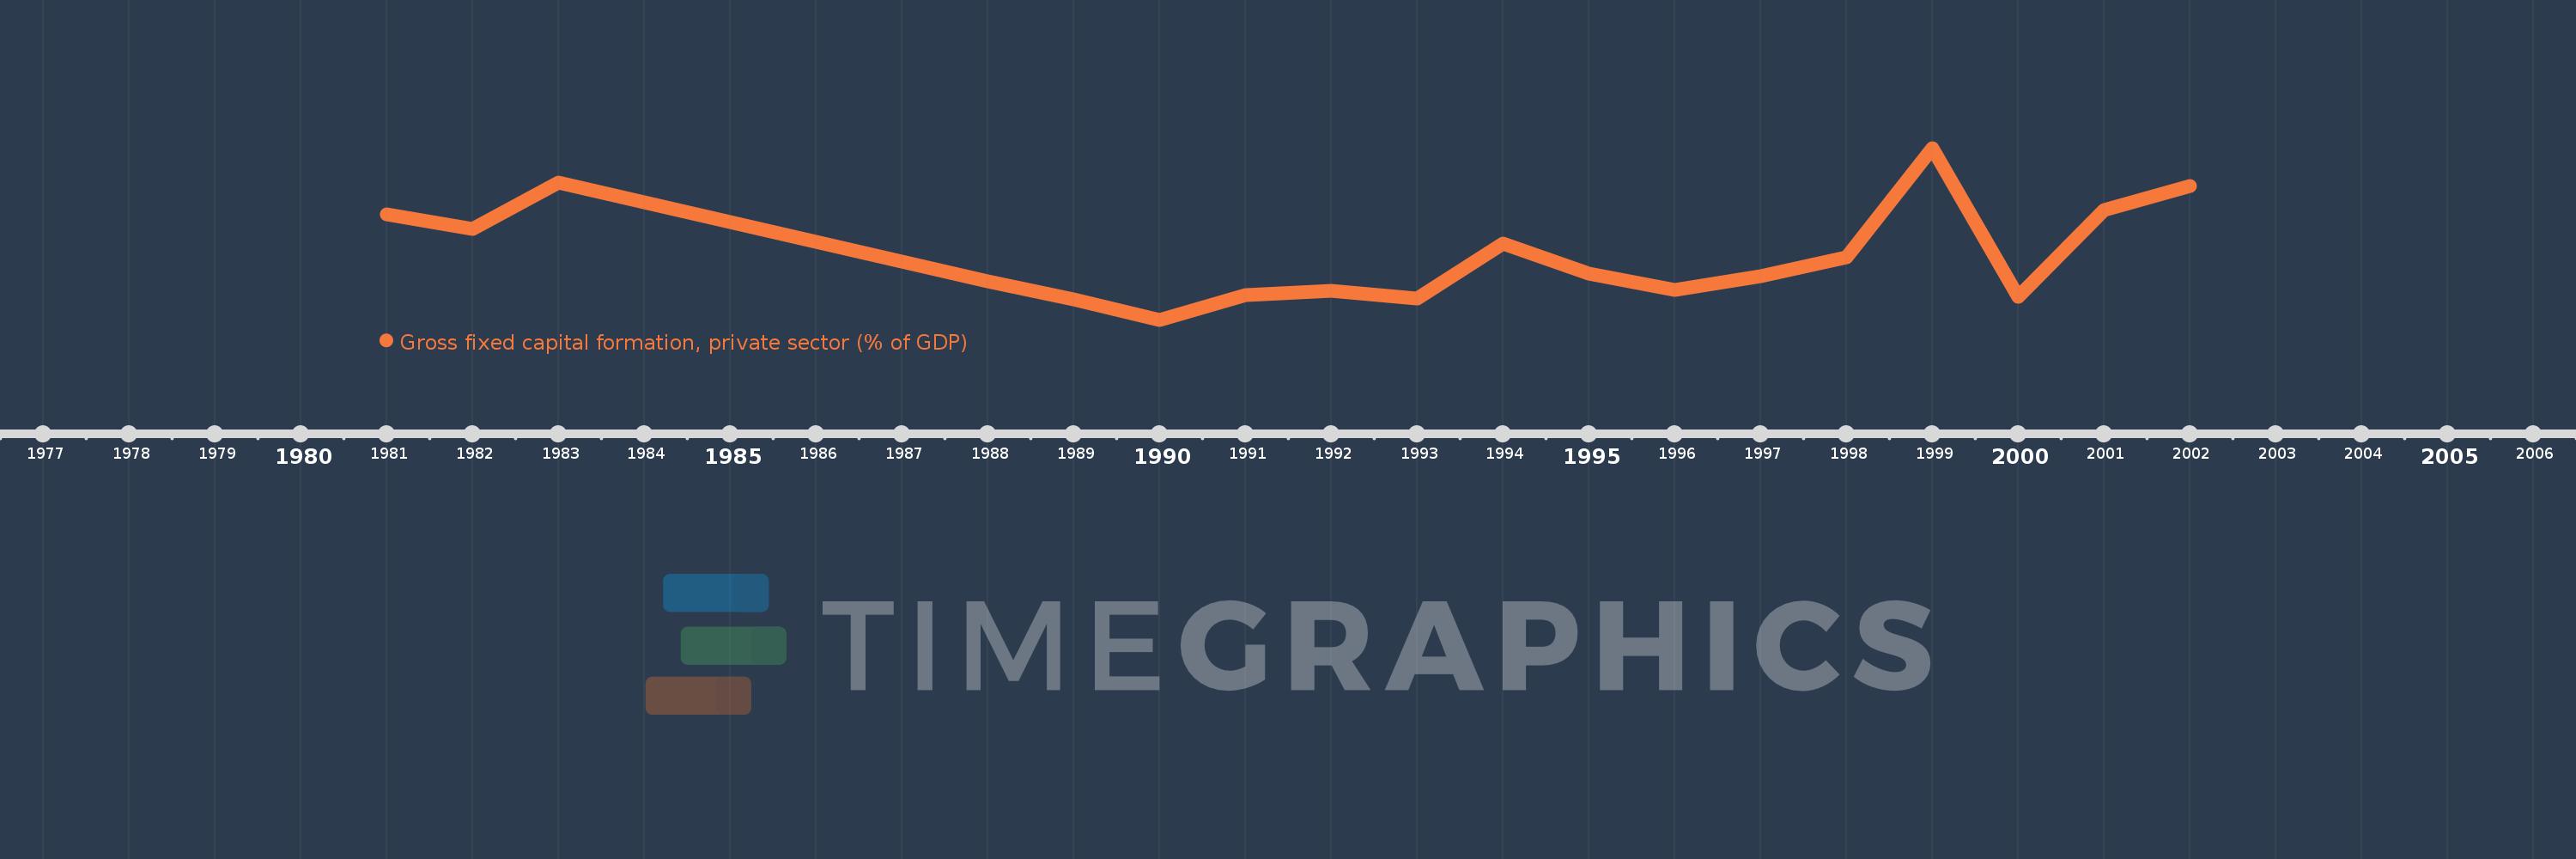
Gross fixed capital formation, private sector (% of GDP)
2002,2001,2000,1999,1998,1997,1996,1995,1994,1993,1992,1991,1990,1989,1988,1983,1982,1981
Cette statistique dans les autres pays:
La ligne de temps
Cette échelle de temps montre un graphique de 1981 année à 2002 année Oman. Les données jusqu'à 1980 année ne sont pas présentés. Quantité d'observations actuelles selon dates: 18.
Source (désignation):
Les indicateurs du développement mondiale
Source (organisation):
World Bank national accounts data, and OECD National Accounts data files.
Catégories:
Economy & Growth
Dernière mise à jour
23 avr. 2017
Les indicateurs de changement de valeurs selon les années
Minimum:
4.226
1 janv. 1990
Maximum:
9.831
1 janv. 1999
Pour la date d''observation
Valeur
Changement absolu
Le changement par rapport à la valeur précédente
1 janv. 1981
7.671
+7.671
0.0%
1 janv. 1982
7.191
-0.48
-6.26%
1 janv. 1983
8.699
+1.508
20.98%
1 janv. 1988
5.48
-3.219
-37.0%
1 janv. 1989
4.891
-0.59
-10.76%
1 janv. 1990
4.226
-0.664
-13.58%
1 janv. 1991
5.039
+0.813
19.23%
1 janv. 1992
5.157
+0.118
2.35%
1 janv. 1993
4.929
-0.228
-4.43%
1 janv. 1994
6.712
+1.783
36.16%
1 janv. 1995
5.731
-0.98
-14.6%
1 janv. 1996
5.208
-0.523
-9.13%
1 janv. 1997
5.657
+0.449
8.62%
1 janv. 1998
6.26
+0.603
10.66%
1 janv. 1999
9.831
+3.571
57.04%
1 janv. 2000
4.964
-4.867
-49.51%
1 janv. 2001
7.794
+2.83
57.01%
1 janv. 2002
8.588
+0.794
10.18%
Classement des pays selon les statistiques actuelles par années


Commentaires: