29
/fr/
fr
AIzaSyAYiBZKx7MnpbEhh9jyipgxe19OcubqV5w
April 1, 2024
231107
Rwanda
RWA
true
2
1
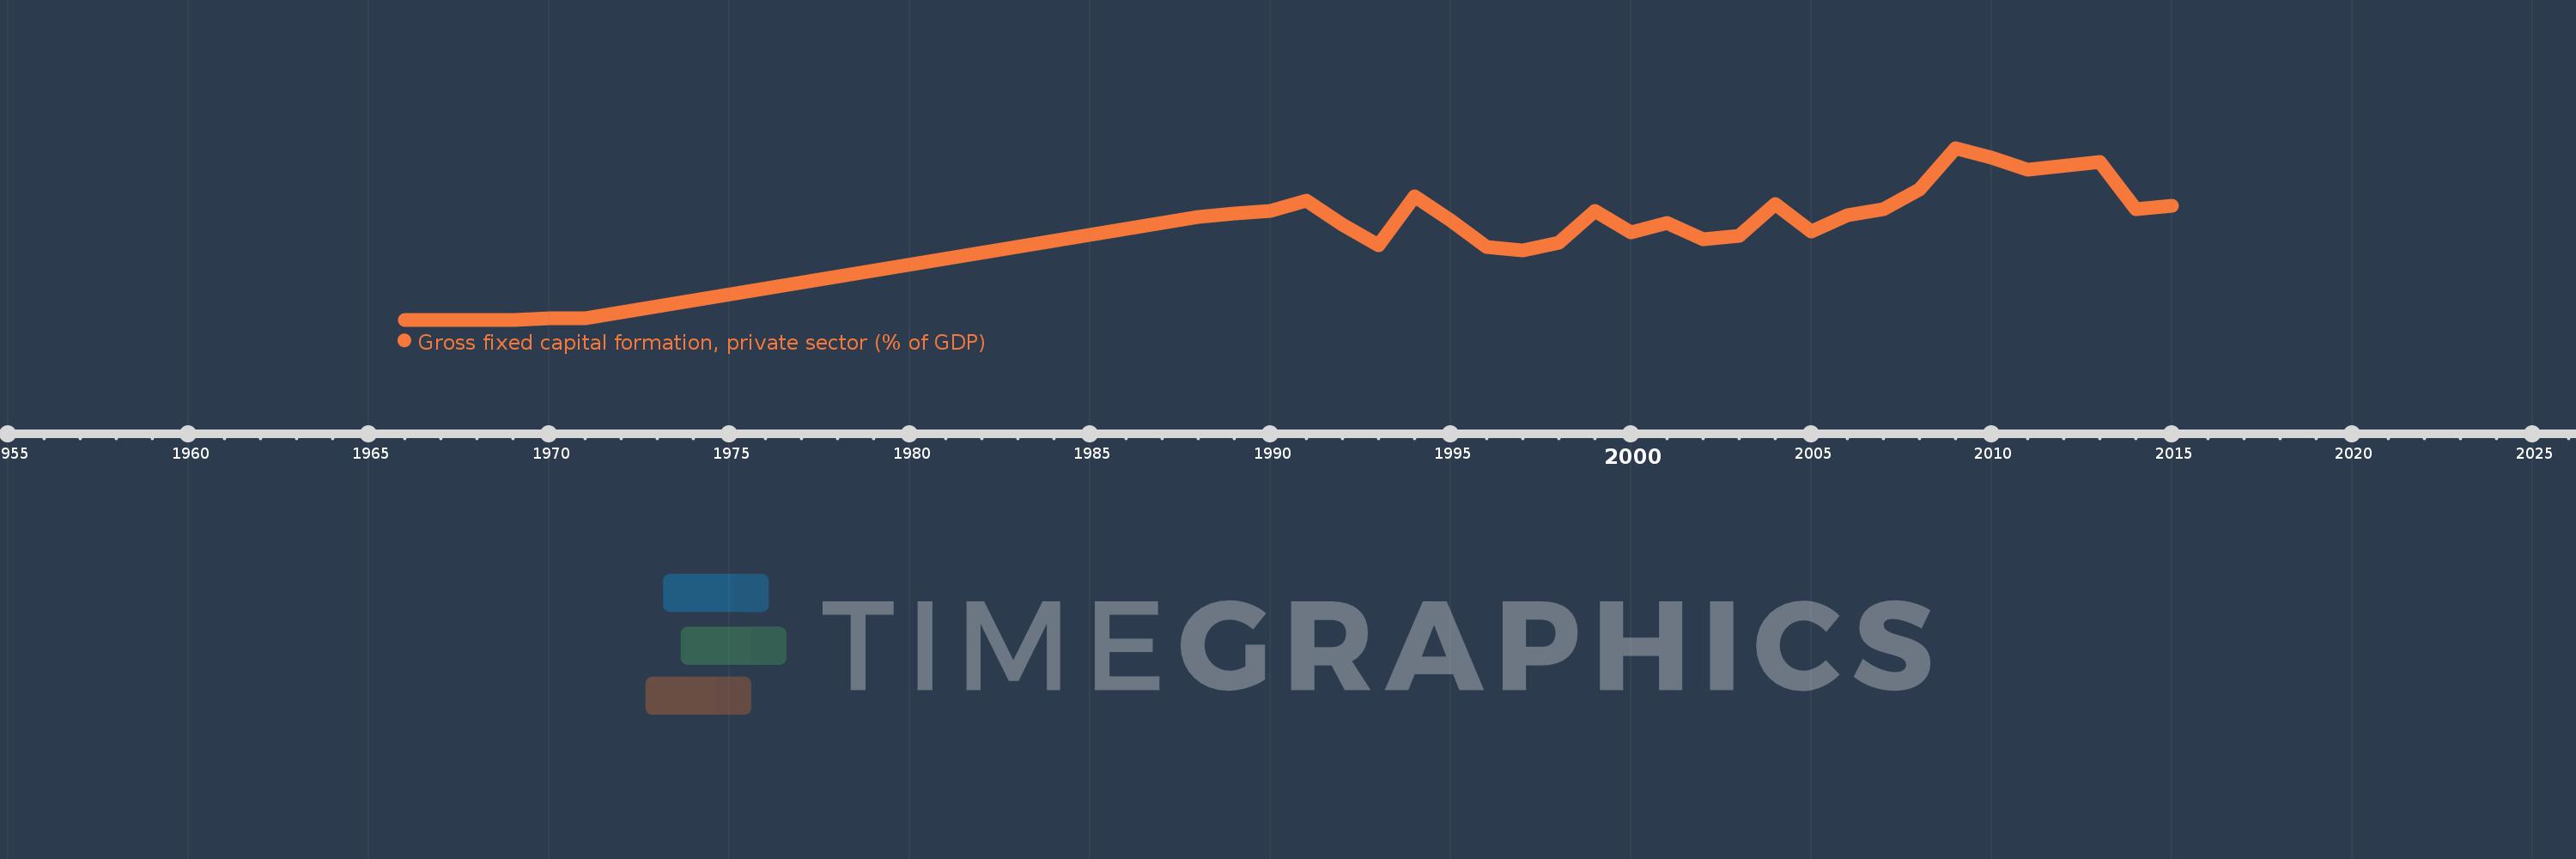
Gross fixed capital formation, private sector (% of GDP)
2015,2014,2013,2011,2010,2009,2008,2007,2006,2005,2004,2003,2002,2001,2000,1999,1998,1997,1996,1995,1994,1993,1992,1991,1990,1989,1988,1971,1970,1969,1968,1967,1966
Cette statistique dans les autres pays:
La ligne de temps
Cette échelle de temps montre un graphique de 1966 année à 2015 année Rwanda. Les données jusqu'à 1965 année ne sont pas présentés. Quantité d'observations actuelles selon dates: 33.
Source (désignation):
Les indicateurs du développement mondiale
Source (organisation):
World Bank national accounts data, and OECD National Accounts data files.
Catégories:
Economy & Growth
Dernière mise à jour
23 avr. 2017
Les indicateurs de changement de valeurs selon les années
Maximum:
12.61
1 janv. 2009
Pour la date d''observation
Valeur
Changement absolu
Le changement par rapport à la valeur précédente
1 janv. 1970
0.106
+0.106
%
1 janv. 1971
0.136
+0.03
28.72%
1 janv. 1988
7.518
+7.381
5.41 milles%
1 janv. 1989
7.816
+0.298
3.96%
1 janv. 1990
7.977
+0.162
2.07%
1 janv. 1991
8.722
+0.745
9.34%
1 janv. 1992
7.005
-1.718
-19.69%
1 janv. 1993
5.483
-1.522
-21.72%
1 janv. 1994
9.066
+3.583
65.35%
1 janv. 1995
7.307
-1.759
-19.4%
1 janv. 1996
5.33
-1.977
-27.06%
1 janv. 1997
5.08
-0.25
-4.7%
1 janv. 1998
5.642
+0.563
11.07%
1 janv. 1999
7.999
+2.357
41.78%
1 janv. 2000
6.427
-1.572
-19.66%
1 janv. 2001
7.09
+0.663
10.31%
1 janv. 2002
5.926
-1.164
-16.42%
1 janv. 2003
6.142
+0.216
3.64%
1 janv. 2004
8.489
+2.347
38.22%
1 janv. 2005
6.487
-2.002
-23.59%
1 janv. 2006
7.662
+1.175
18.11%
1 janv. 2007
8.115
+0.454
5.92%
1 janv. 2008
9.583
+1.468
18.09%
1 janv. 2009
12.61
+3.027
31.58%
1 janv. 2010
11.869
-0.741
-5.88%
1 janv. 2011
11.032
-0.837
-7.05%
1 janv. 2013
11.578
+0.546
4.95%
1 janv. 2014
8.094
-3.484
-30.09%
1 janv. 2015
8.363
+0.268
3.32%
Classement des pays selon les statistiques actuelles par années


Commentaires: