29
/fr/
fr
AIzaSyAYiBZKx7MnpbEhh9jyipgxe19OcubqV5w
April 1, 2024
59832
Sub-Saharan Africa (excluding high income)
SSA
false
2
1
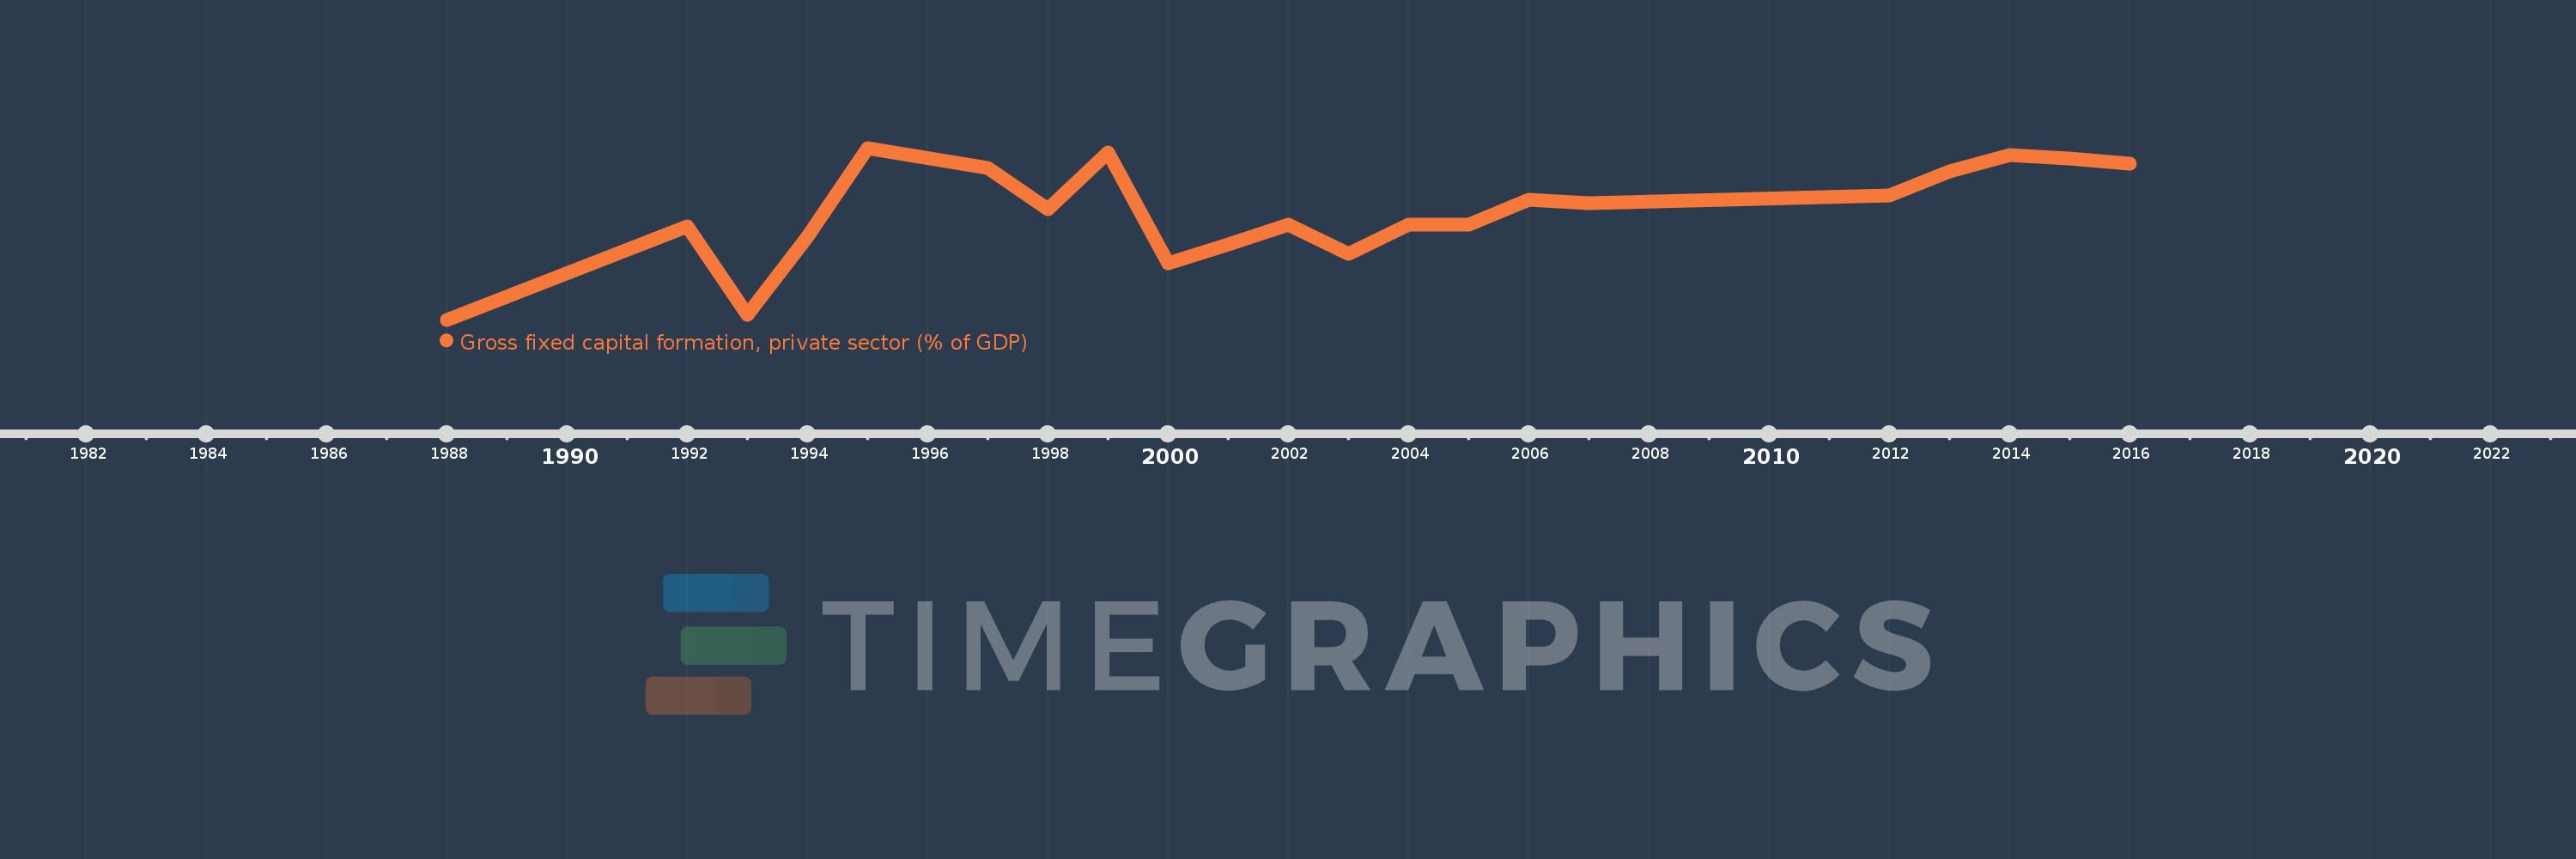
Gross fixed capital formation, private sector (% of GDP)
2016,2015,2014,2013,2012,2007,2006,2005,2004,2003,2002,2001,2000,1999,1998,1997,1995,1994,1993,1992,1988
Cette statistique dans les autres pays:
La ligne de temps
Cette échelle de temps montre un graphique de 1988 année à 2016 année Sub-Saharan Africa (excluding high income). Les données jusqu'à 1987 année ne sont pas présentés. Quantité d'observations actuelles selon dates: 21.
Source (désignation):
Les indicateurs du développement mondiale
Source (organisation):
World Bank national accounts data, and OECD National Accounts data files.
Catégories:
Economy & Growth
Dernière mise à jour
23 avr. 2017
Les indicateurs de changement de valeurs selon les années
Minimum:
9.979
1 janv. 1988
Maximum:
14.104
1 janv. 1995
Pour la date d''observation
Valeur
Changement absolu
Le changement par rapport à la valeur précédente
1 janv. 1988
9.979
+9.979
0.0%
1 janv. 1992
12.212
+2.233
22.38%
1 janv. 1993
10.1
-2.111
-17.29%
1 janv. 1994
11.97
+1.869
18.51%
1 janv. 1995
14.104
+2.135
17.83%
1 janv. 1997
13.632
-0.472
-3.35%
1 janv. 1998
12.638
-0.994
-7.29%
1 janv. 1999
13.987
+1.349
10.67%
1 janv. 2000
11.335
-2.652
-18.96%
1 janv. 2001
11.787
+0.453
3.99%
1 janv. 2002
12.255
+0.468
3.97%
1 janv. 2003
11.553
-0.702
-5.73%
1 janv. 2004
12.252
+0.698
6.05%
1 janv. 2005
12.258
+0.006
0.05%
1 janv. 2006
12.863
+0.604
4.93%
1 janv. 2007
12.774
-0.088
-0.69%
1 janv. 2012
12.961
+0.187
1.46%
1 janv. 2013
13.542
+0.581
4.48%
1 janv. 2014
13.936
+0.394
2.91%
1 janv. 2015
13.848
-0.088
-0.63%
1 janv. 2016
13.732
-0.117
-0.84%
Classement des pays selon les statistiques actuelles par années


Commentaires: