29
/fr/
fr
AIzaSyAYiBZKx7MnpbEhh9jyipgxe19OcubqV5w
April 1, 2024
202985
Mozambique
MOZ
true
2
1
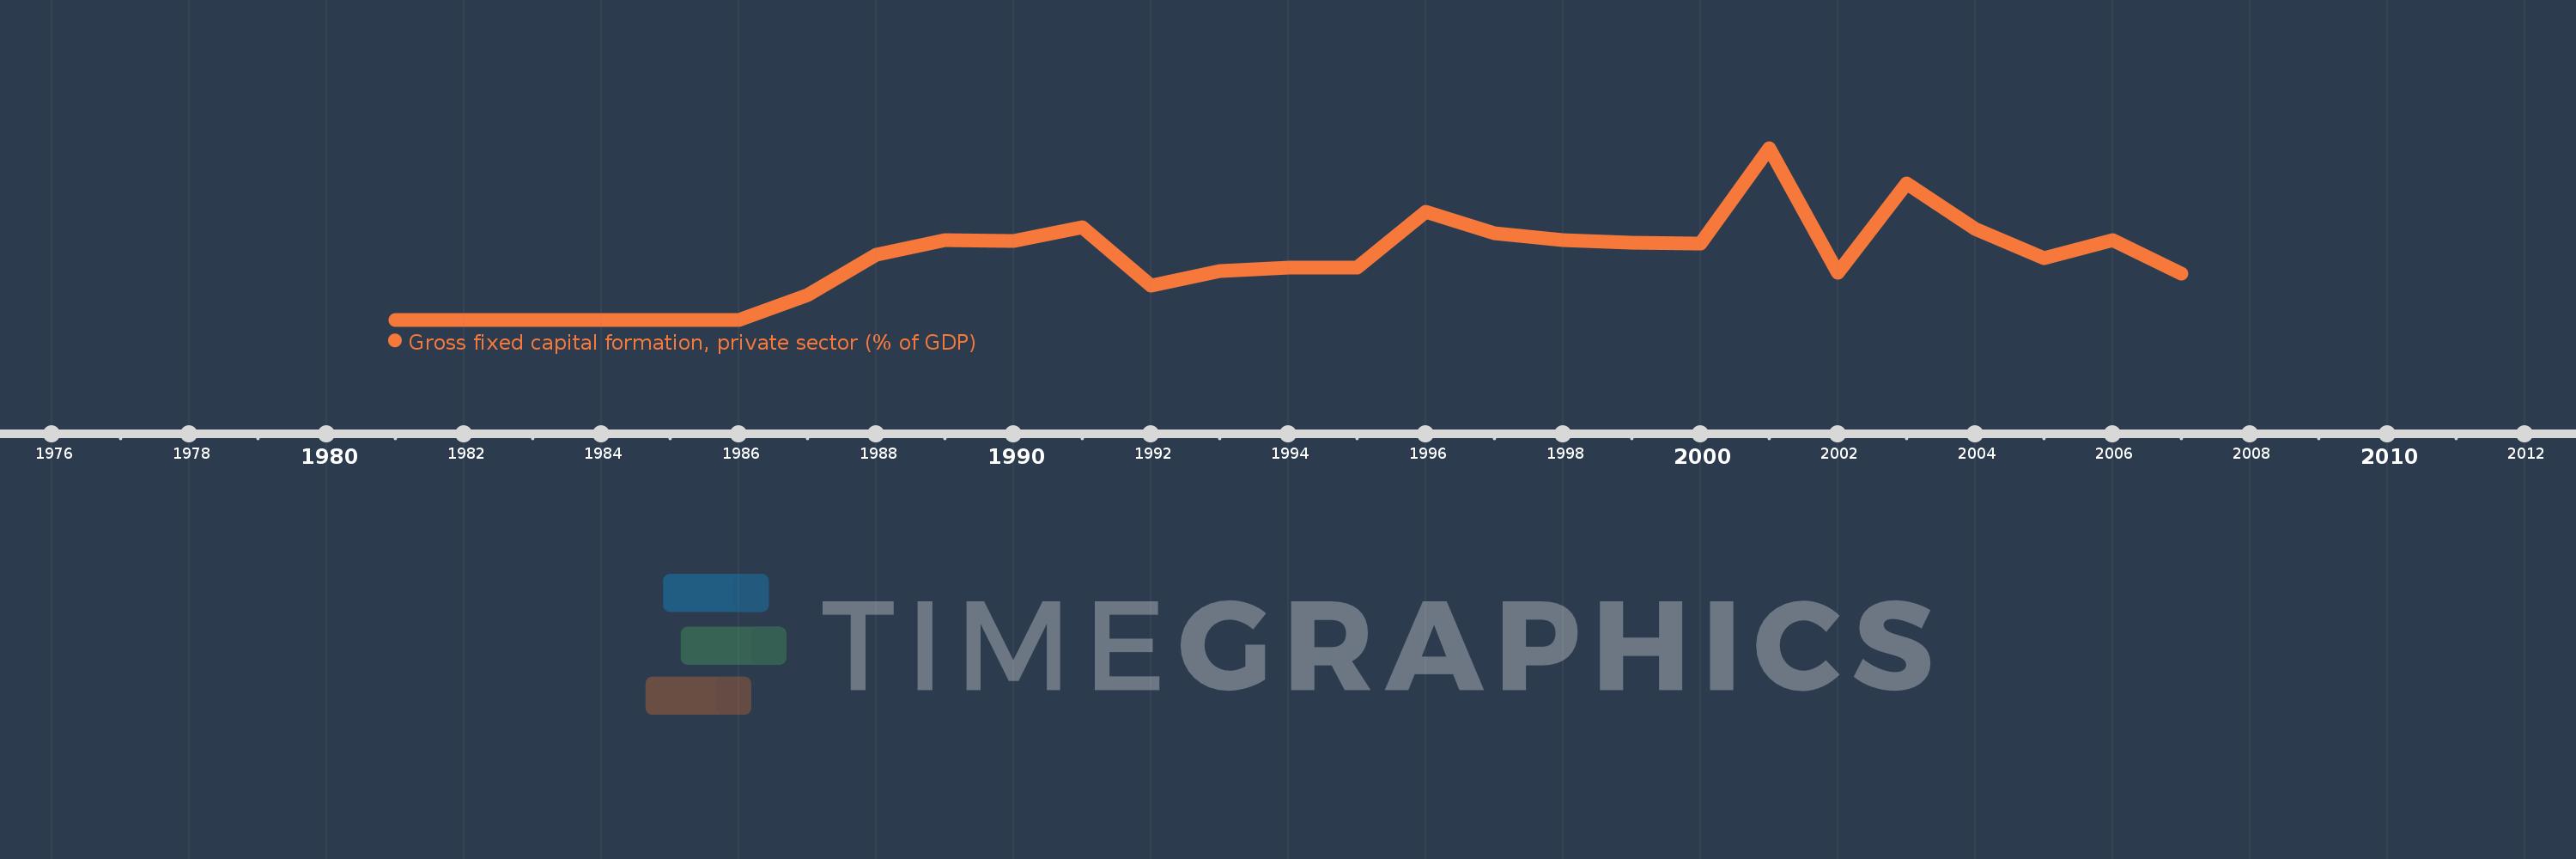
Gross fixed capital formation, private sector (% of GDP)
2007,2006,2005,2004,2003,2002,2001,2000,1999,1998,1997,1996,1995,1994,1993,1992,1991,1990,1989,1988,1987,1986,1985,1984,1983,1982,1981
Cette statistique dans les autres pays:
La ligne de temps
Cette échelle de temps montre un graphique de 1981 année à 2007 année Mozambique. Les données jusqu'à 1980 année ne sont pas présentés. Quantité d'observations actuelles selon dates: 27.
Source (désignation):
Les indicateurs du développement mondiale
Source (organisation):
World Bank national accounts data, and OECD National Accounts data files.
Catégories:
Economy & Growth
Dernière mise à jour
23 avr. 2017
Les indicateurs de changement de valeurs selon les années
Maximum:
18.66
1 janv. 2001
Pour la date d''observation
Valeur
Changement absolu
Le changement par rapport à la valeur précédente
1 janv. 1987
2.657
+2.657
%
1 janv. 1988
7.078
+4.421
166.43%
1 janv. 1989
8.67
+1.592
22.49%
1 janv. 1990
8.574
-0.096
-1.11%
1 janv. 1991
10.063
+1.489
17.36%
1 janv. 1992
3.701
-6.361
-63.22%
1 janv. 1993
5.278
+1.577
42.61%
1 janv. 1994
5.702
+0.424
8.03%
1 janv. 1995
5.654
-0.048
-0.85%
1 janv. 1996
11.698
+6.044
106.91%
1 janv. 1997
9.386
-2.312
-19.76%
1 janv. 1998
8.684
-0.702
-7.47%
1 janv. 1999
8.366
-0.318
-3.67%
1 janv. 2000
8.244
-0.122
-1.46%
1 janv. 2001
18.66
+10.416
126.35%
1 janv. 2002
5.109
-13.551
-72.62%
1 janv. 2003
14.797
+9.688
189.64%
1 janv. 2004
9.855
-4.942
-33.4%
1 janv. 2005
6.66
-3.194
-32.41%
1 janv. 2006
8.64
+1.98
29.72%
1 janv. 2007
4.985
-3.655
-42.3%
Classement des pays selon les statistiques actuelles par années


Commentaires: