29
/fr/
fr
AIzaSyAYiBZKx7MnpbEhh9jyipgxe19OcubqV5w
April 1, 2024
115146
Croatia
HRV
true
2
1
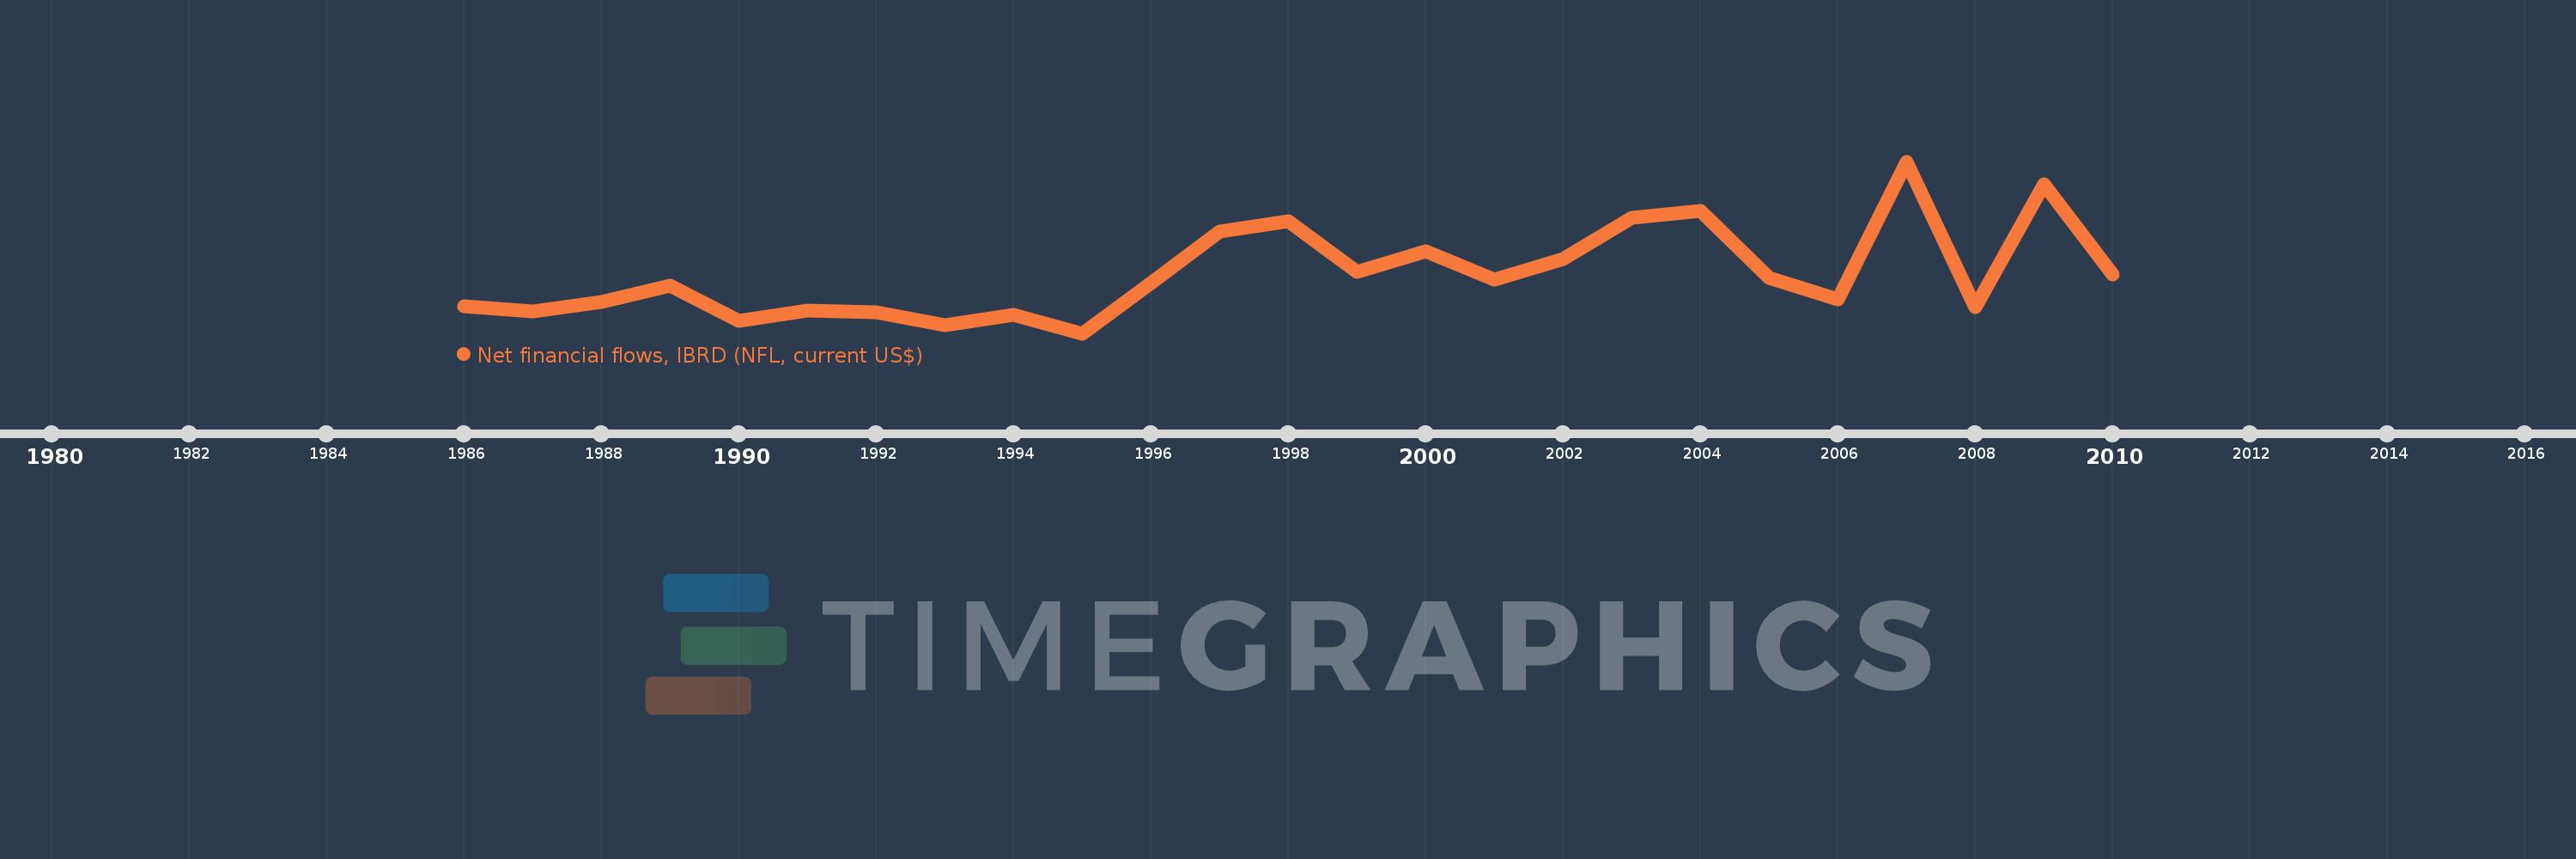
Net financial flows, IBRD (NFL, current US$)
2010,2009,2008,2007,2006,2005,2004,2003,2002,2001,2000,1999,1998,1997,1996,1995,1994,1993,1992,1991,1990,1989,1988,1987,1986
Cette statistique dans les autres pays:
La ligne de temps
Cette échelle de temps montre un graphique de 1986 année à 2010 année Croatia. Les données jusqu'à 1985 année ne sont pas présentés. Quantité d'observations actuelles selon dates: 25.
Source (désignation):
Les indicateurs du développement mondiale
Source (organisation):
World Bank, International Debt Statistics.
Catégories:
External Debt
Dernière mise à jour
23 avr. 2017
Les indicateurs de changement de valeurs selon les années
Minimum:
-28.082 mln.
1 janv. 1995
Maximum:
169.489 mln.
1 janv. 2007
Pour la date d''observation
Valeur
Changement absolu
Le changement par rapport à la valeur précédente
1 janv. 1986
2.592 mln.
+2.592 mln.
0.0%
1 janv. 1987
-2.715 mln.
-5.307 mln.
-204.73%
1 janv. 1988
7.658 mln.
+10.373 mln.
-382.07%
1 janv. 1989
27.086 mln.
+19.427 mln.
253.68%
1 janv. 1990
-13.521 mln.
-40.607 mln.
-149.92%
1 janv. 1991
-2.192 mln.
+11.329 mln.
-83.79%
1 janv. 1992
-3.77 mln.
-1.578 mln.
71.98%
1 janv. 1993
-18.405 mln.
-14.634 mln.
388.18%
1 janv. 1994
-6.614 mln.
+11.791 mln.
-64.06%
1 janv. 1995
-28.082 mln.
-21.468 mln.
324.59%
1 janv. 1996
29.352 mln.
+57.434 mln.
-204.52%
1 janv. 1997
88.903 mln.
+59.552 mln.
202.89%
1 janv. 1998
100.396 mln.
+11.493 mln.
12.93%
1 janv. 1999
42.127 mln.
-58.269 mln.
-58.04%
1 janv. 2000
66.628 mln.
+24.501 mln.
58.16%
1 janv. 2001
33.534 mln.
-33.094 mln.
-49.67%
1 janv. 2002
56.903 mln.
+23.369 mln.
69.69%
1 janv. 2003
104.774 mln.
+47.871 mln.
84.13%
1 janv. 2004
112.589 mln.
+7.815 mln.
7.46%
1 janv. 2005
35.946 mln.
-76.643 mln.
-68.07%
1 janv. 2006
11.018 mln.
-24.927 mln.
-69.35%
1 janv. 2007
169.489 mln.
+158.471 mln.
1.44 milles%
1 janv. 2008
2.283 mln.
-167.206 mln.
-98.65%
1 janv. 2009
143.025 mln.
+140.743 mln.
6.17 milles%
1 janv. 2010
39.757 mln.
-103.269 mln.
-72.2%
Classement des pays selon les statistiques actuelles par années


Commentaires: