29
/fr/
fr
AIzaSyAYiBZKx7MnpbEhh9jyipgxe19OcubqV5w
April 1, 2024
236139
Senegal
SEN
true
2
1
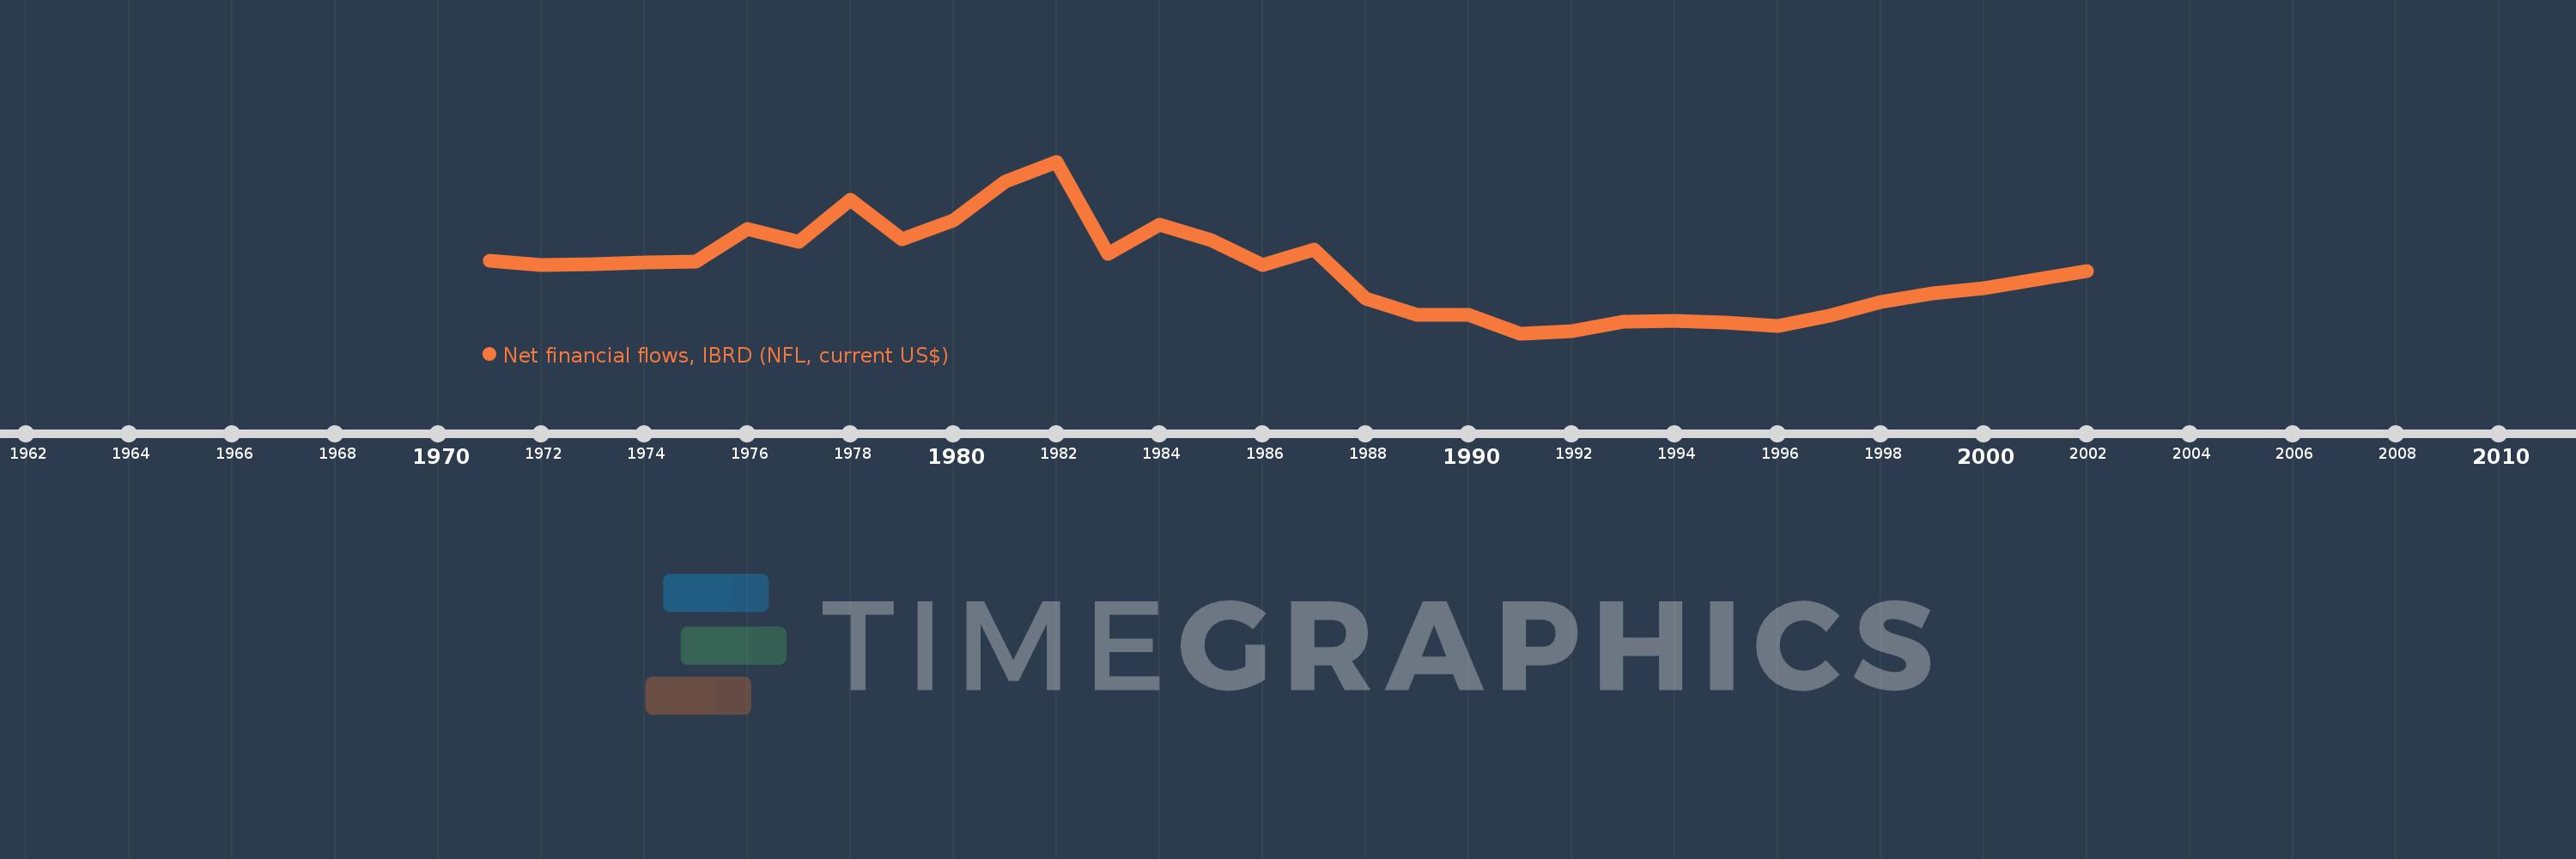
Net financial flows, IBRD (NFL, current US$)
2002,2001,2000,1999,1998,1997,1996,1995,1994,1993,1992,1991,1990,1989,1988,1987,1986,1985,1984,1983,1982,1981,1980,1979,1978,1977,1976,1975,1974,1973,1972,1971
Cette statistique dans les autres pays:
La ligne de temps
Cette échelle de temps montre un graphique de 1971 année à 2002 année Senegal. Les données jusqu'à 1970 année ne sont pas présentés. Quantité d'observations actuelles selon dates: 32.
Source (désignation):
Les indicateurs du développement mondiale
Source (organisation):
World Bank, International Debt Statistics.
Catégories:
External Debt
Dernière mise à jour
23 avr. 2017
Les indicateurs de changement de valeurs selon les années
Minimum:
-13.197 mln.
1 janv. 1991
Maximum:
19.867 mln.
1 janv. 1982
Pour la date d''observation
Valeur
Changement absolu
Le changement par rapport à la valeur précédente
1 janv. 1971
784.0 milles
+784.0 milles
0.0%
1 janv. 1972
-36.0 milles
-820.0 milles
-104.59%
1 janv. 1973
102.0 milles
+138.0 milles
-383.33%
1 janv. 1974
448.0 milles
+346.0 milles
339.22%
1 janv. 1975
550.0 milles
+102.0 milles
22.77%
1 janv. 1976
6.877 mln.
+6.327 mln.
1.15 milles%
1 janv. 1977
4.425 mln.
-2.452 mln.
-35.66%
1 janv. 1978
12.497 mln.
+8.072 mln.
182.42%
1 janv. 1979
4.98 mln.
-7.517 mln.
-60.15%
1 janv. 1980
8.529 mln.
+3.549 mln.
71.27%
1 janv. 1981
15.962 mln.
+7.433 mln.
87.15%
1 janv. 1982
19.867 mln.
+3.905 mln.
24.46%
1 janv. 1983
2.134 mln.
-17.733 mln.
-89.26%
1 janv. 1984
7.723 mln.
+5.589 mln.
261.9%
1 janv. 1985
4.676 mln.
-3.047 mln.
-39.45%
1 janv. 1986
-100.0 milles
-4.776 mln.
-102.14%
1 janv. 1987
2.853 mln.
+2.953 mln.
-2.95 milles%
1 janv. 1988
-6.584 mln.
-9.437 mln.
-330.77%
1 janv. 1989
-9.578 mln.
-2.994 mln.
45.47%
1 janv. 1990
-9.608 mln.
-30.0 milles
0.31%
1 janv. 1991
-13.197 mln.
-3.589 mln.
37.35%
1 janv. 1992
-12.726 mln.
+471.0 milles
-3.57%
1 janv. 1993
-10.997 mln.
+1.729 mln.
-13.59%
1 janv. 1994
-10.725 mln.
+272.0 milles
-2.47%
1 janv. 1995
-11.135 mln.
-410.0 milles
3.82%
1 janv. 1996
-11.801 mln.
-666.0 milles
5.98%
1 janv. 1997
-9.809 mln.
+1.992 mln.
-16.88%
1 janv. 1998
-7.152 mln.
+2.657 mln.
-27.09%
1 janv. 1999
-5.472 mln.
+1.68 mln.
-23.49%
1 janv. 2000
-4.45 mln.
+1.022 mln.
-18.68%
1 janv. 2001
-2.836 mln.
+1.614 mln.
-36.27%
1 janv. 2002
-1.253 mln.
+1.583 mln.
-55.82%
Classement des pays selon les statistiques actuelles par années


Commentaires: