29
/fr/
fr
AIzaSyAYiBZKx7MnpbEhh9jyipgxe19OcubqV5w
April 1, 2024
165212
Jordan
JOR
true
2
1
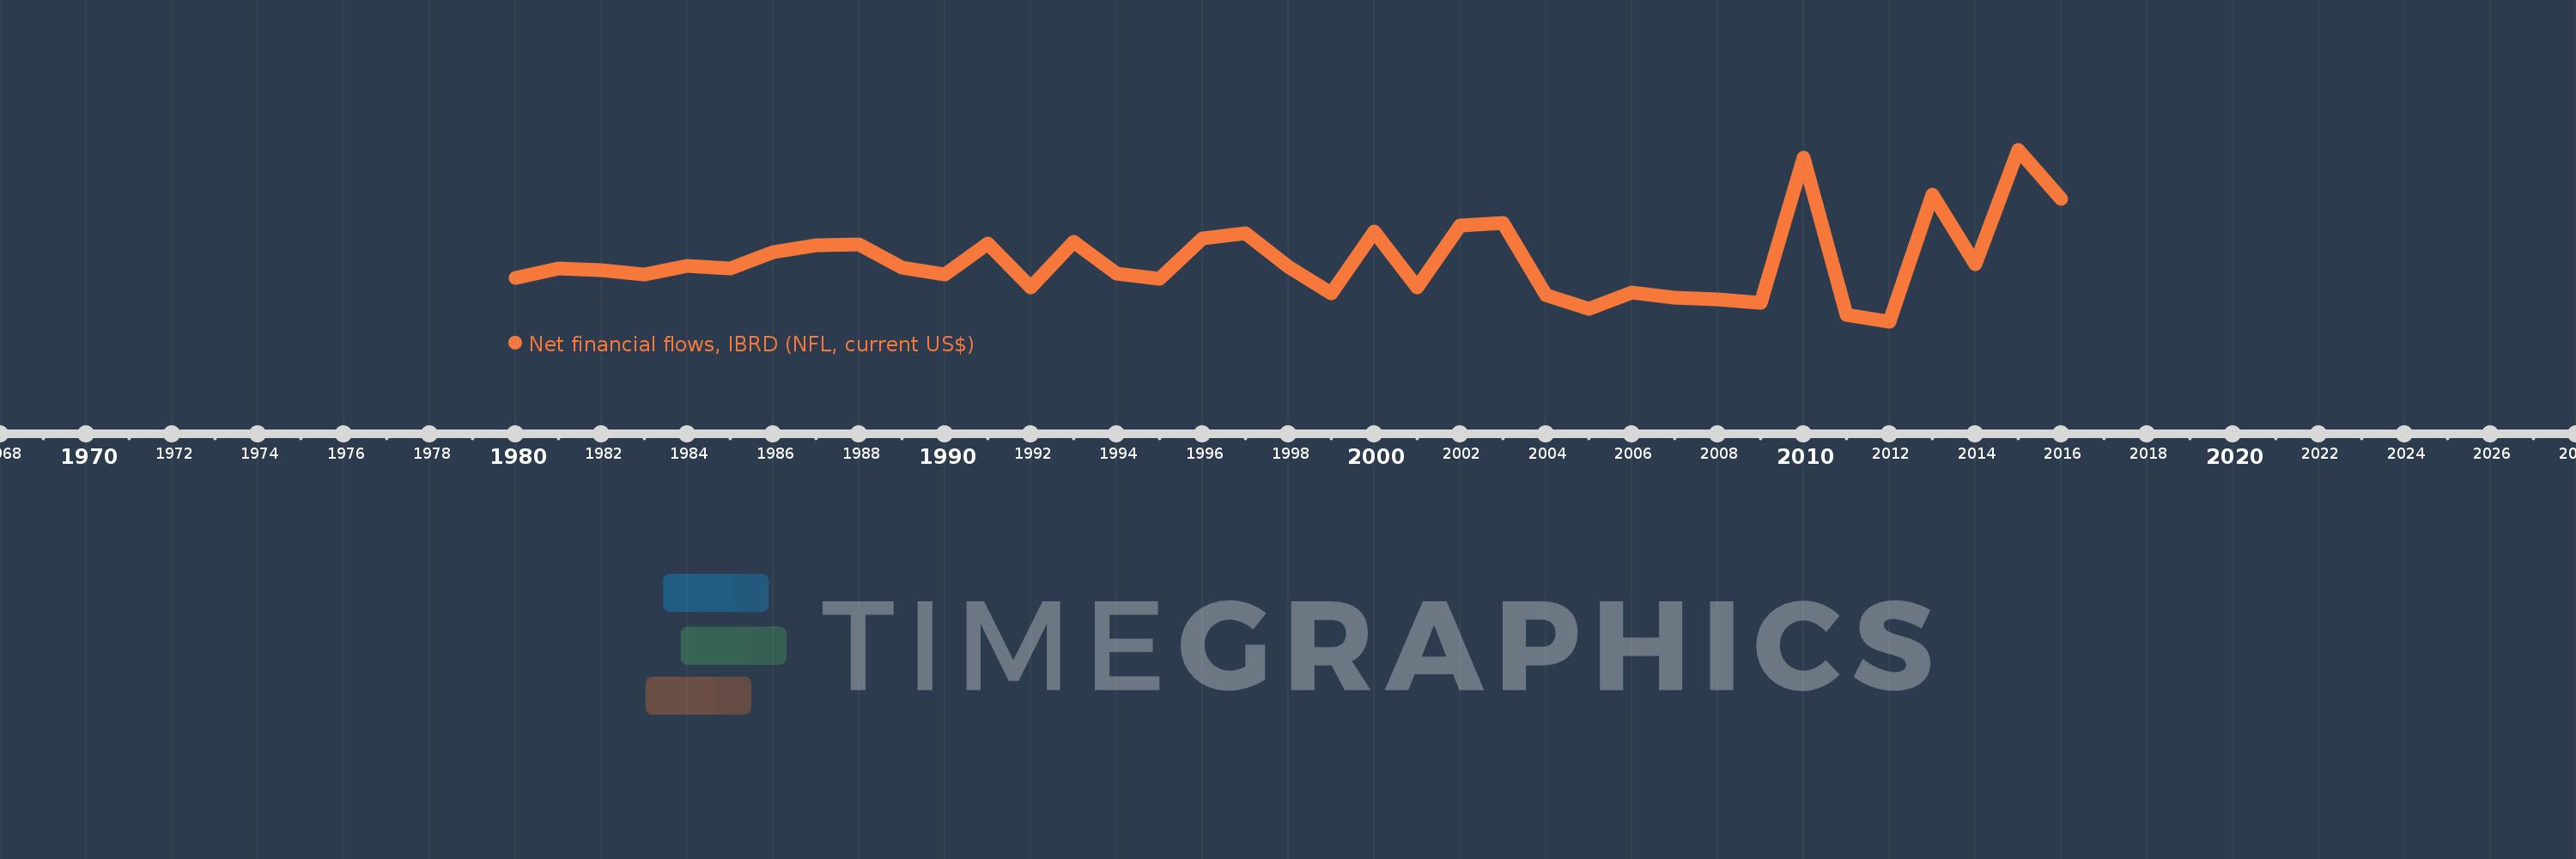
Net financial flows, IBRD (NFL, current US$)
2016,2015,2014,2013,2012,2011,2010,2009,2008,2007,2006,2005,2004,2003,2002,2001,2000,1999,1998,1997,1996,1995,1994,1993,1992,1991,1990,1989,1988,1987,1986,1985,1984,1983,1982,1981,1980
Cette statistique dans les autres pays:
La ligne de temps
Cette échelle de temps montre un graphique de 1980 année à 2016 année Jordan. Les données jusqu'à 1979 année ne sont pas présentés. Quantité d'observations actuelles selon dates: 37.
Source (désignation):
Les indicateurs du développement mondiale
Source (organisation):
World Bank, International Debt Statistics.
Catégories:
External Debt
Dernière mise à jour
23 avr. 2017
Les indicateurs de changement de valeurs selon les années
Minimum:
-82.704 mln.
1 janv. 2012
Maximum:
254.157 mln.
1 janv. 2015
Pour la date d''observation
Valeur
Changement absolu
Le changement par rapport à la valeur précédente
1 janv. 1980
3.722 mln.
+3.722 mln.
0.0%
1 janv. 1981
22.256 mln.
+18.534 mln.
497.96%
1 janv. 1982
19.153 mln.
-3.103 mln.
-13.94%
1 janv. 1983
10.609 mln.
-8.544 mln.
-44.61%
1 janv. 1984
27.175 mln.
+16.566 mln.
156.15%
1 janv. 1985
22.939 mln.
-4.236 mln.
-15.59%
1 janv. 1986
54.597 mln.
+31.658 mln.
138.01%
1 janv. 1987
67.817 mln.
+13.22 mln.
24.21%
1 janv. 1988
69.713 mln.
+1.896 mln.
2.8%
1 janv. 1989
23.956 mln.
-45.757 mln.
-65.64%
1 janv. 1990
9.739 mln.
-14.217 mln.
-59.35%
1 janv. 1991
70.57 mln.
+60.831 mln.
624.61%
1 janv. 1992
-14.597 mln.
-85.167 mln.
-120.68%
1 janv. 1993
73.88 mln.
+88.477 mln.
-606.13%
1 janv. 1994
11.876 mln.
-62.004 mln.
-83.93%
1 janv. 1995
1.806 mln.
-10.07 mln.
-84.79%
1 janv. 1996
81.05 mln.
+79.244 mln.
4.39 milles%
1 janv. 1997
90.886 mln.
+9.836 mln.
12.14%
1 janv. 1998
25.039 mln.
-65.847 mln.
-72.45%
1 janv. 1999
-27.406 mln.
-52.445 mln.
-209.45%
1 janv. 2000
95.069 mln.
+122.475 mln.
-446.89%
1 janv. 2001
-14.76 mln.
-109.829 mln.
-115.53%
1 janv. 2002
106.427 mln.
+121.187 mln.
-821.05%
1 janv. 2003
110.674 mln.
+4.247 mln.
3.99%
1 janv. 2004
-30.002 mln.
-140.676 mln.
-127.11%
1 janv. 2005
-56.73 mln.
-26.728 mln.
89.09%
1 janv. 2006
-25.035 mln.
+31.695 mln.
-55.87%
1 janv. 2007
-35.084 mln.
-10.049 mln.
40.14%
1 janv. 2008
-38.359 mln.
-3.275 mln.
9.33%
1 janv. 2009
-44.43 mln.
-6.071 mln.
15.83%
1 janv. 2010
240.01 mln.
+284.44 mln.
-640.2%
1 janv. 2011
-68.526 mln.
-308.536 mln.
-128.55%
1 janv. 2012
-82.704 mln.
-14.178 mln.
20.69%
1 janv. 2013
167.36 mln.
+250.064 mln.
-302.36%
1 janv. 2014
30.748 mln.
-136.612 mln.
-81.63%
1 janv. 2015
254.157 mln.
+223.409 mln.
726.58%
1 janv. 2016
157.846 mln.
-96.311 mln.
-37.89%
Classement des pays selon les statistiques actuelles par années


Commentaires: