29
/fr/
fr
AIzaSyAYiBZKx7MnpbEhh9jyipgxe19OcubqV5w
April 1, 2024
237474
Serbia
SRB
true
2
1
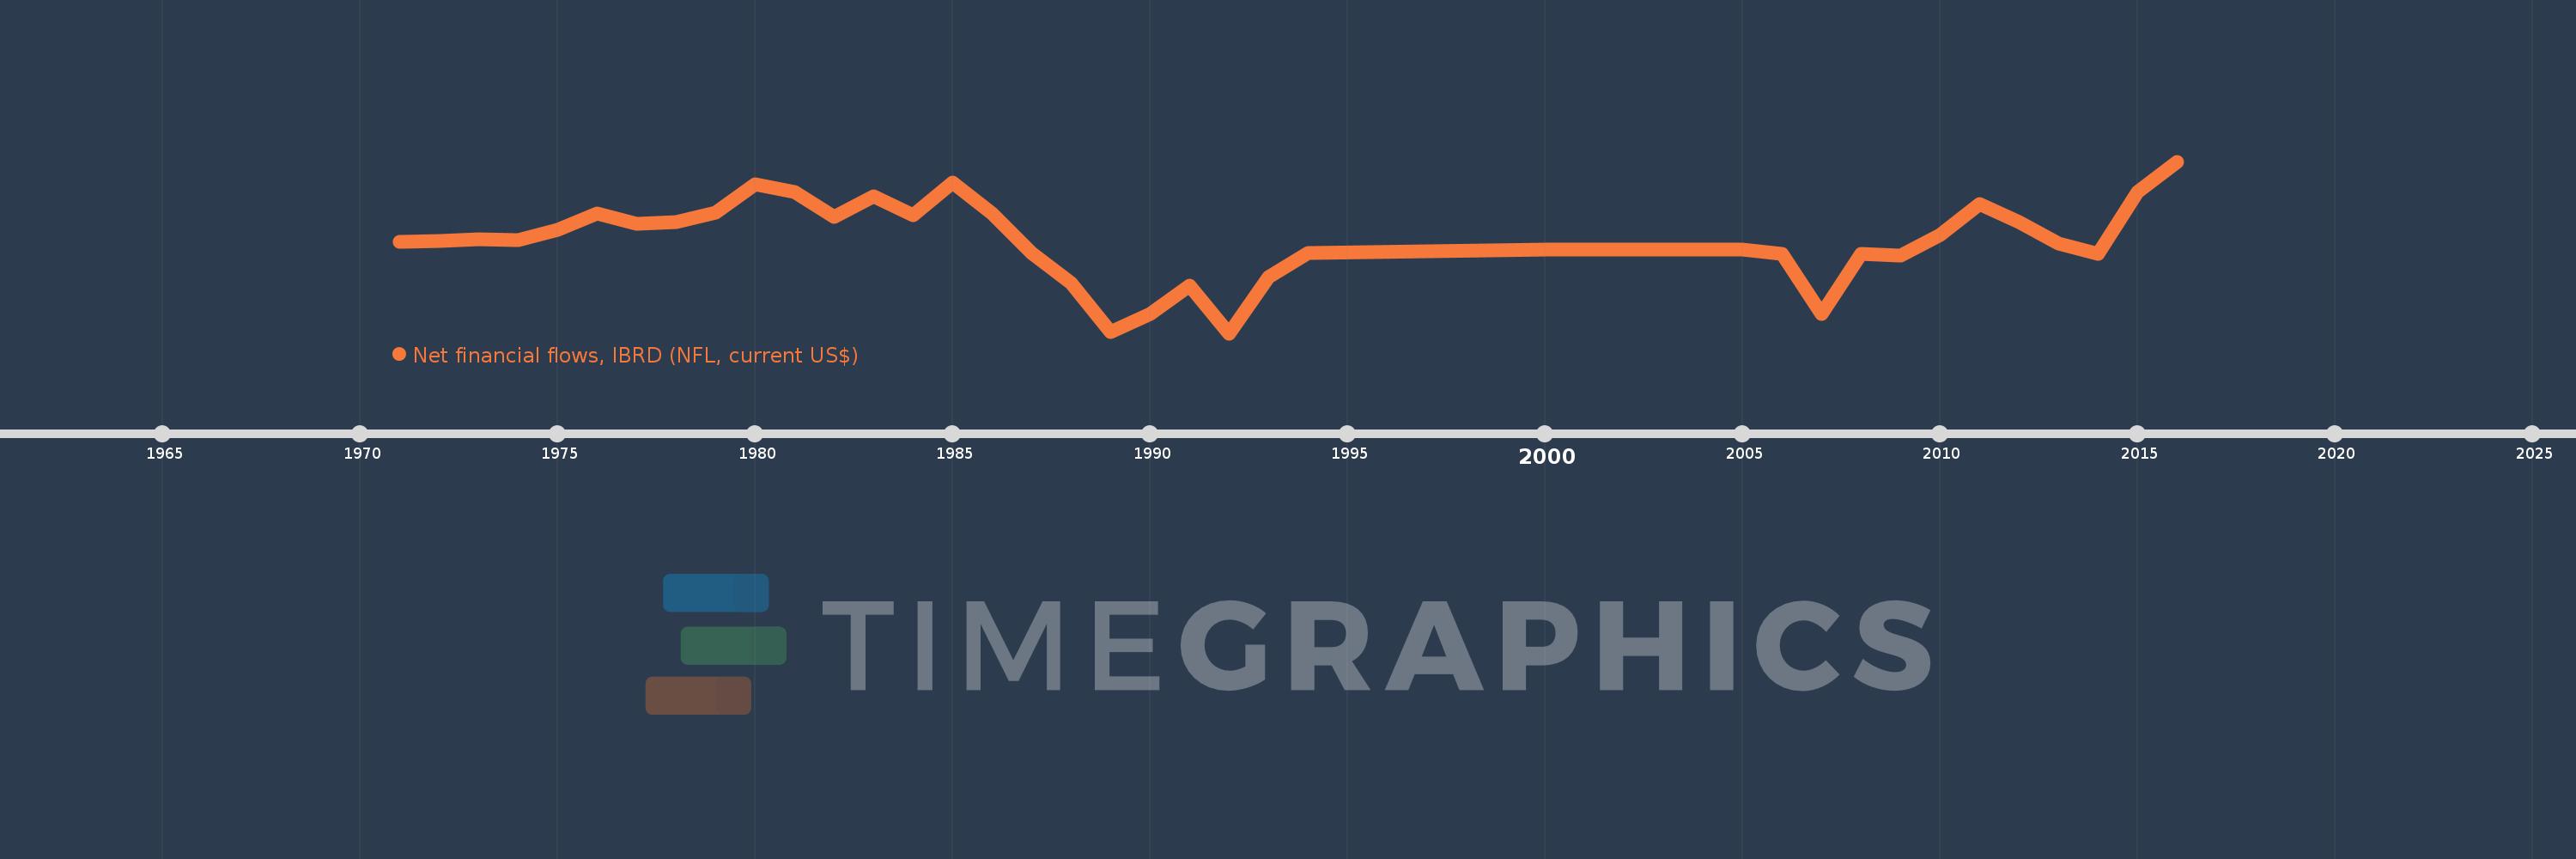
Net financial flows, IBRD (NFL, current US$)
2016,2015,2014,2013,2012,2011,2010,2009,2008,2007,2006,2005,2004,2003,2002,2000,1994,1993,1992,1991,1990,1989,1988,1987,1986,1985,1984,1983,1982,1981,1980,1979,1978,1977,1976,1975,1974,1973,1972,1971
Cette statistique dans les autres pays:
La ligne de temps
Cette échelle de temps montre un graphique de 1971 année à 2016 année Serbia. Les données jusqu'à 1970 année ne sont pas présentés. Quantité d'observations actuelles selon dates: 40.
Source (désignation):
Les indicateurs du développement mondiale
Source (organisation):
World Bank, International Debt Statistics.
Catégories:
External Debt
Dernière mise à jour
23 avr. 2017
Les indicateurs de changement de valeurs selon les années
Minimum:
-315.588 mln.
1 janv. 1992
Maximum:
331.471 mln.
1 janv. 2016
Pour la date d''observation
Valeur
Changement absolu
Le changement par rapport à la valeur précédente
1 janv. 1971
27.422 mln.
+27.422 mln.
0.0%
1 janv. 1972
33.199 mln.
+5.777 mln.
21.07%
1 janv. 1973
39.536 mln.
+6.337 mln.
19.09%
1 janv. 1974
35.18 mln.
-4.356 mln.
-11.02%
1 janv. 1975
72.929 mln.
+37.749 mln.
107.3%
1 janv. 1976
134.552 mln.
+61.623 mln.
84.5%
1 janv. 1977
95.991 mln.
-38.561 mln.
-28.66%
1 janv. 1978
103.014 mln.
+7.023 mln.
7.32%
1 janv. 1979
139.432 mln.
+36.418 mln.
35.35%
1 janv. 1980
245.402 mln.
+105.97 mln.
76.0%
1 janv. 1981
215.854 mln.
-29.548 mln.
-12.04%
1 janv. 1982
123.898 mln.
-91.956 mln.
-42.6%
1 janv. 1983
201.063 mln.
+77.165 mln.
62.28%
1 janv. 1984
130.493 mln.
-70.57 mln.
-35.1%
1 janv. 1985
251.513 mln.
+121.02 mln.
92.74%
1 janv. 1986
134.347 mln.
-117.166 mln.
-46.58%
1 janv. 1987
-14.118 mln.
-148.465 mln.
-110.51%
1 janv. 1988
-127.196 mln.
-113.078 mln.
800.95%
1 janv. 1989
-311.877 mln.
-184.681 mln.
145.19%
1 janv. 1990
-243.899 mln.
+67.978 mln.
-21.8%
1 janv. 1991
-135.791 mln.
+108.108 mln.
-44.32%
1 janv. 1992
-315.588 mln.
-179.797 mln.
132.41%
1 janv. 1993
-103.166 mln.
+212.422 mln.
-67.31%
1 janv. 1994
-12.406 mln.
+90.76 mln.
-87.97%
1 janv. 2000
0.0
+12.406 mln.
-100.0%
1 janv. 2006
-17.125 mln.
-17.125 mln.
%
1 janv. 2007
-242.369 mln.
-225.244 mln.
1.32 milles%
1 janv. 2008
-17.479 mln.
+224.89 mln.
-92.79%
1 janv. 2009
-22.145 mln.
-4.666 mln.
26.69%
1 janv. 2010
55.721 mln.
+77.866 mln.
-351.62%
1 janv. 2011
172.042 mln.
+116.321 mln.
208.76%
1 janv. 2012
102.096 mln.
-69.946 mln.
-40.66%
1 janv. 2013
21.682 mln.
-80.414 mln.
-78.76%
1 janv. 2014
-16.772 mln.
-38.454 mln.
-177.35%
1 janv. 2015
217.726 mln.
+234.498 mln.
-1.4 milles%
1 janv. 2016
331.471 mln.
+113.745 mln.
52.24%
Classement des pays selon les statistiques actuelles par années


Commentaires: