29
/fr/
fr
AIzaSyAYiBZKx7MnpbEhh9jyipgxe19OcubqV5w
April 1, 2024
112624
Costa Rica
CRI
true
2
1
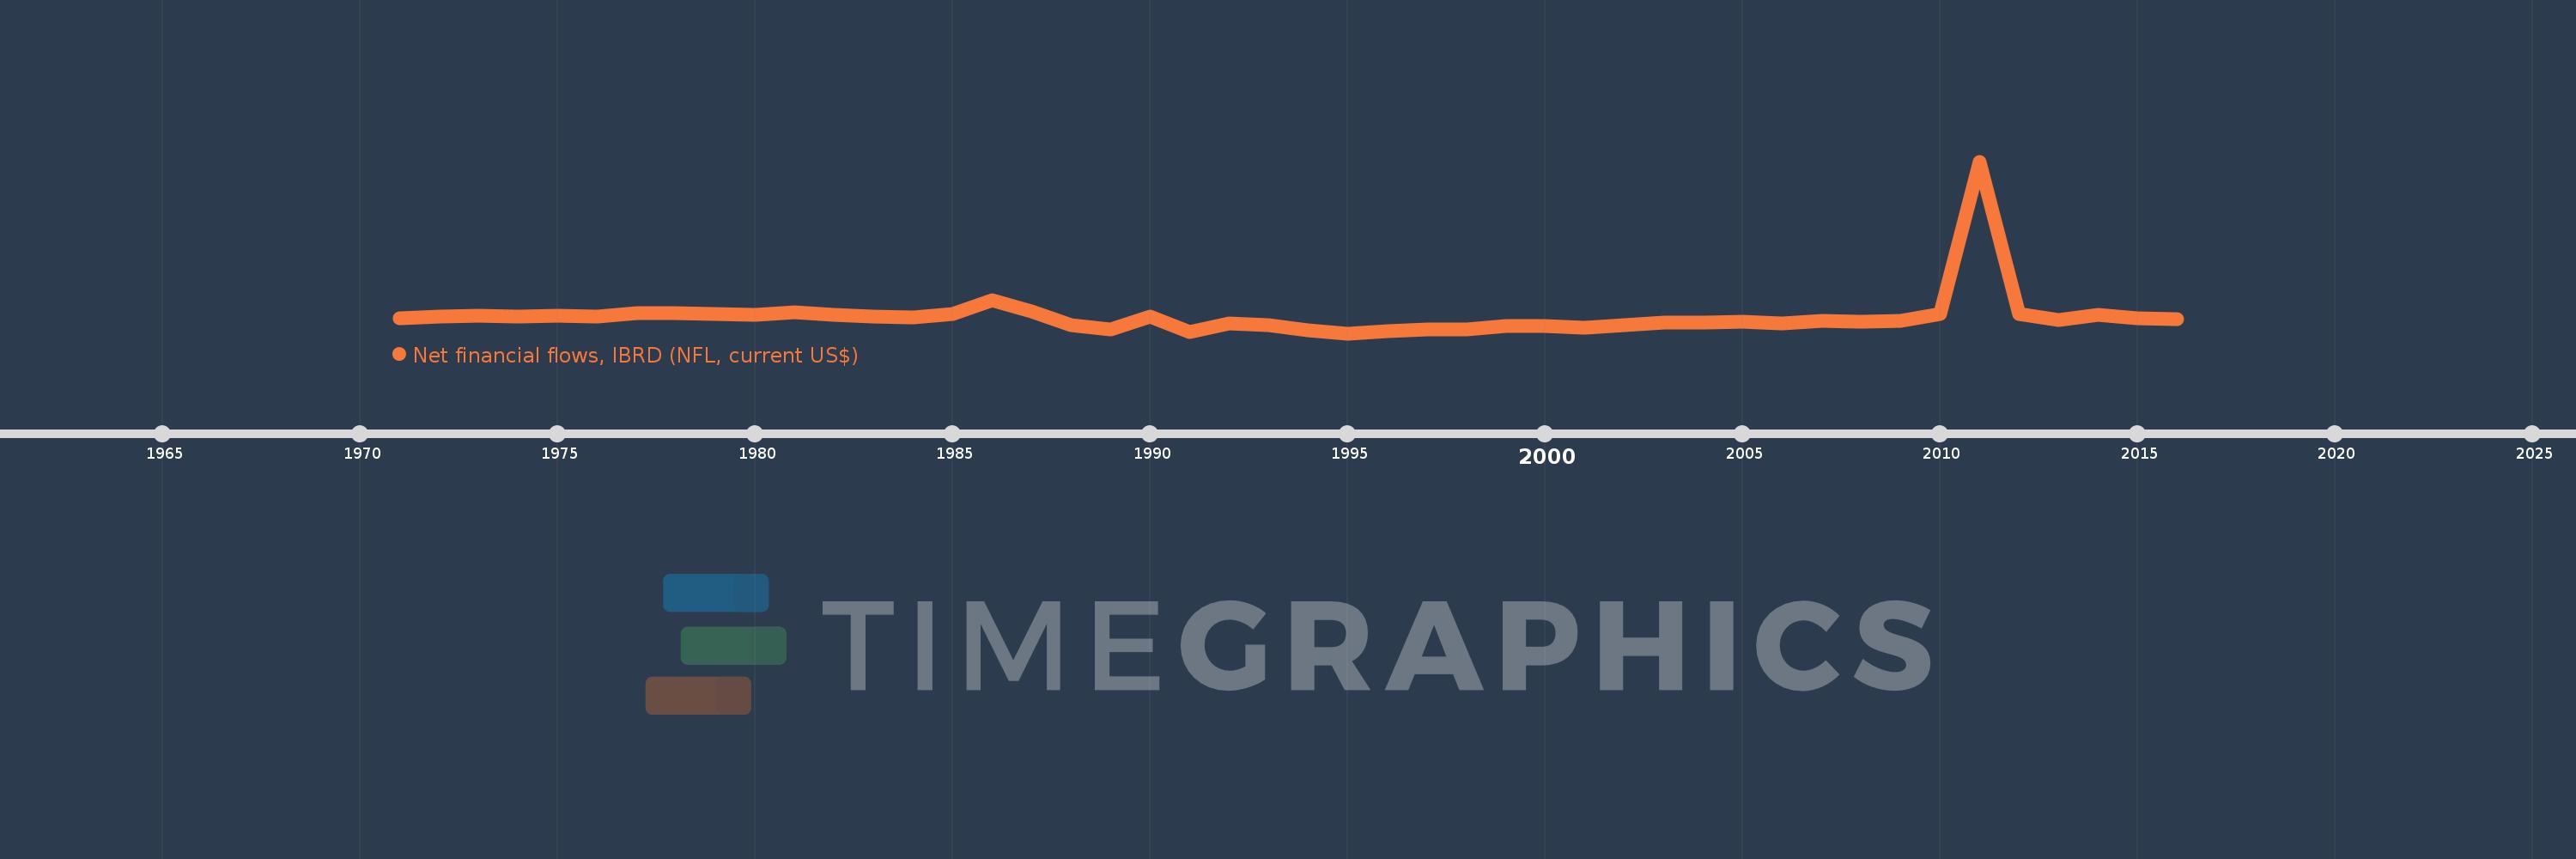
Net financial flows, IBRD (NFL, current US$)
2016,2015,2014,2013,2012,2011,2010,2009,2008,2007,2006,2005,2004,2003,2002,2001,2000,1999,1998,1997,1996,1995,1994,1993,1992,1991,1990,1989,1988,1987,1986,1985,1984,1983,1982,1981,1980,1979,1978,1977,1976,1975,1974,1973,1972,1971
Cette statistique dans les autres pays:
La ligne de temps
Cette échelle de temps montre un graphique de 1971 année à 2016 année Costa Rica. Les données jusqu'à 1970 année ne sont pas présentés. Quantité d'observations actuelles selon dates: 46.
Source (désignation):
Les indicateurs du développement mondiale
Source (organisation):
World Bank, International Debt Statistics.
Catégories:
External Debt
Dernière mise à jour
23 avr. 2017
Les indicateurs de changement de valeurs selon les années
Minimum:
-45.418 mln.
1 janv. 1995
Maximum:
512.334 mln.
1 janv. 2011
Pour la date d''observation
Valeur
Changement absolu
Le changement par rapport à la valeur précédente
1 janv. 1971
2.952 mln.
+2.952 mln.
0.0%
1 janv. 1972
7.608 mln.
+4.656 mln.
157.72%
1 janv. 1973
11.253 mln.
+3.645 mln.
47.91%
1 janv. 1974
8.741 mln.
-2.512 mln.
-22.32%
1 janv. 1975
11.503 mln.
+2.762 mln.
31.6%
1 janv. 1976
9.867 mln.
-1.636 mln.
-14.22%
1 janv. 1977
18.911 mln.
+9.044 mln.
91.66%
1 janv. 1978
20.093 mln.
+1.182 mln.
6.25%
1 janv. 1979
16.779 mln.
-3.314 mln.
-16.49%
1 janv. 1980
14.632 mln.
-2.147 mln.
-12.8%
1 janv. 1981
22.805 mln.
+8.173 mln.
55.86%
1 janv. 1982
13.751 mln.
-9.054 mln.
-39.7%
1 janv. 1983
7.62 mln.
-6.131 mln.
-44.59%
1 janv. 1984
5.974 mln.
-1.646 mln.
-21.6%
1 janv. 1985
18.271 mln.
+12.297 mln.
205.84%
1 janv. 1986
63.272 mln.
+45.001 mln.
246.3%
1 janv. 1987
26.663 mln.
-36.609 mln.
-57.86%
1 janv. 1988
-18.457 mln.
-45.12 mln.
-169.22%
1 janv. 1989
-32.79 mln.
-14.333 mln.
77.66%
1 janv. 1990
8.765 mln.
+41.555 mln.
-126.73%
1 janv. 1991
-40.012 mln.
-48.777 mln.
-556.5%
1 janv. 1992
-12.647 mln.
+27.365 mln.
-68.39%
1 janv. 1993
-18.393 mln.
-5.746 mln.
45.43%
1 janv. 1994
-37.002 mln.
-18.609 mln.
101.17%
1 janv. 1995
-45.418 mln.
-8.416 mln.
22.74%
1 janv. 1996
-39.049 mln.
+6.369 mln.
-14.02%
1 janv. 1997
-31.745 mln.
+7.304 mln.
-18.7%
1 janv. 1998
-34.16 mln.
-2.415 mln.
7.61%
1 janv. 1999
-20.613 mln.
+13.547 mln.
-39.66%
1 janv. 2000
-22.573 mln.
-1.96 mln.
9.51%
1 janv. 2001
-27.243 mln.
-4.67 mln.
20.69%
1 janv. 2002
-18.601 mln.
+8.642 mln.
-31.72%
1 janv. 2003
-11.132 mln.
+7.469 mln.
-40.15%
1 janv. 2004
-11.568 mln.
-436.0 milles
3.92%
1 janv. 2005
-8.734 mln.
+2.834 mln.
-24.5%
1 janv. 2006
-12.084 mln.
-3.35 mln.
38.36%
1 janv. 2007
-5.681 mln.
+6.403 mln.
-52.99%
1 janv. 2008
-7.959 mln.
-2.278 mln.
40.1%
1 janv. 2009
-4.239 mln.
+3.72 mln.
-46.74%
1 janv. 2010
16.72 mln.
+20.959 mln.
-494.43%
1 janv. 2011
512.334 mln.
+495.614 mln.
2.96 milles%
1 janv. 2012
16.769 mln.
-495.565 mln.
-96.73%
1 janv. 2013
-1.419 mln.
-18.188 mln.
-108.46%
1 janv. 2014
13.536 mln.
+14.955 mln.
-1.05 milles%
1 janv. 2015
4.535 mln.
-9.001 mln.
-66.5%
1 janv. 2016
1.541 mln.
-2.994 mln.
-66.02%
Classement des pays selon les statistiques actuelles par années


Commentaires: