29
/it/
it
AIzaSyAYiBZKx7MnpbEhh9jyipgxe19OcubqV5w
April 1, 2024
115146
Croatia
HRV
true
2
1
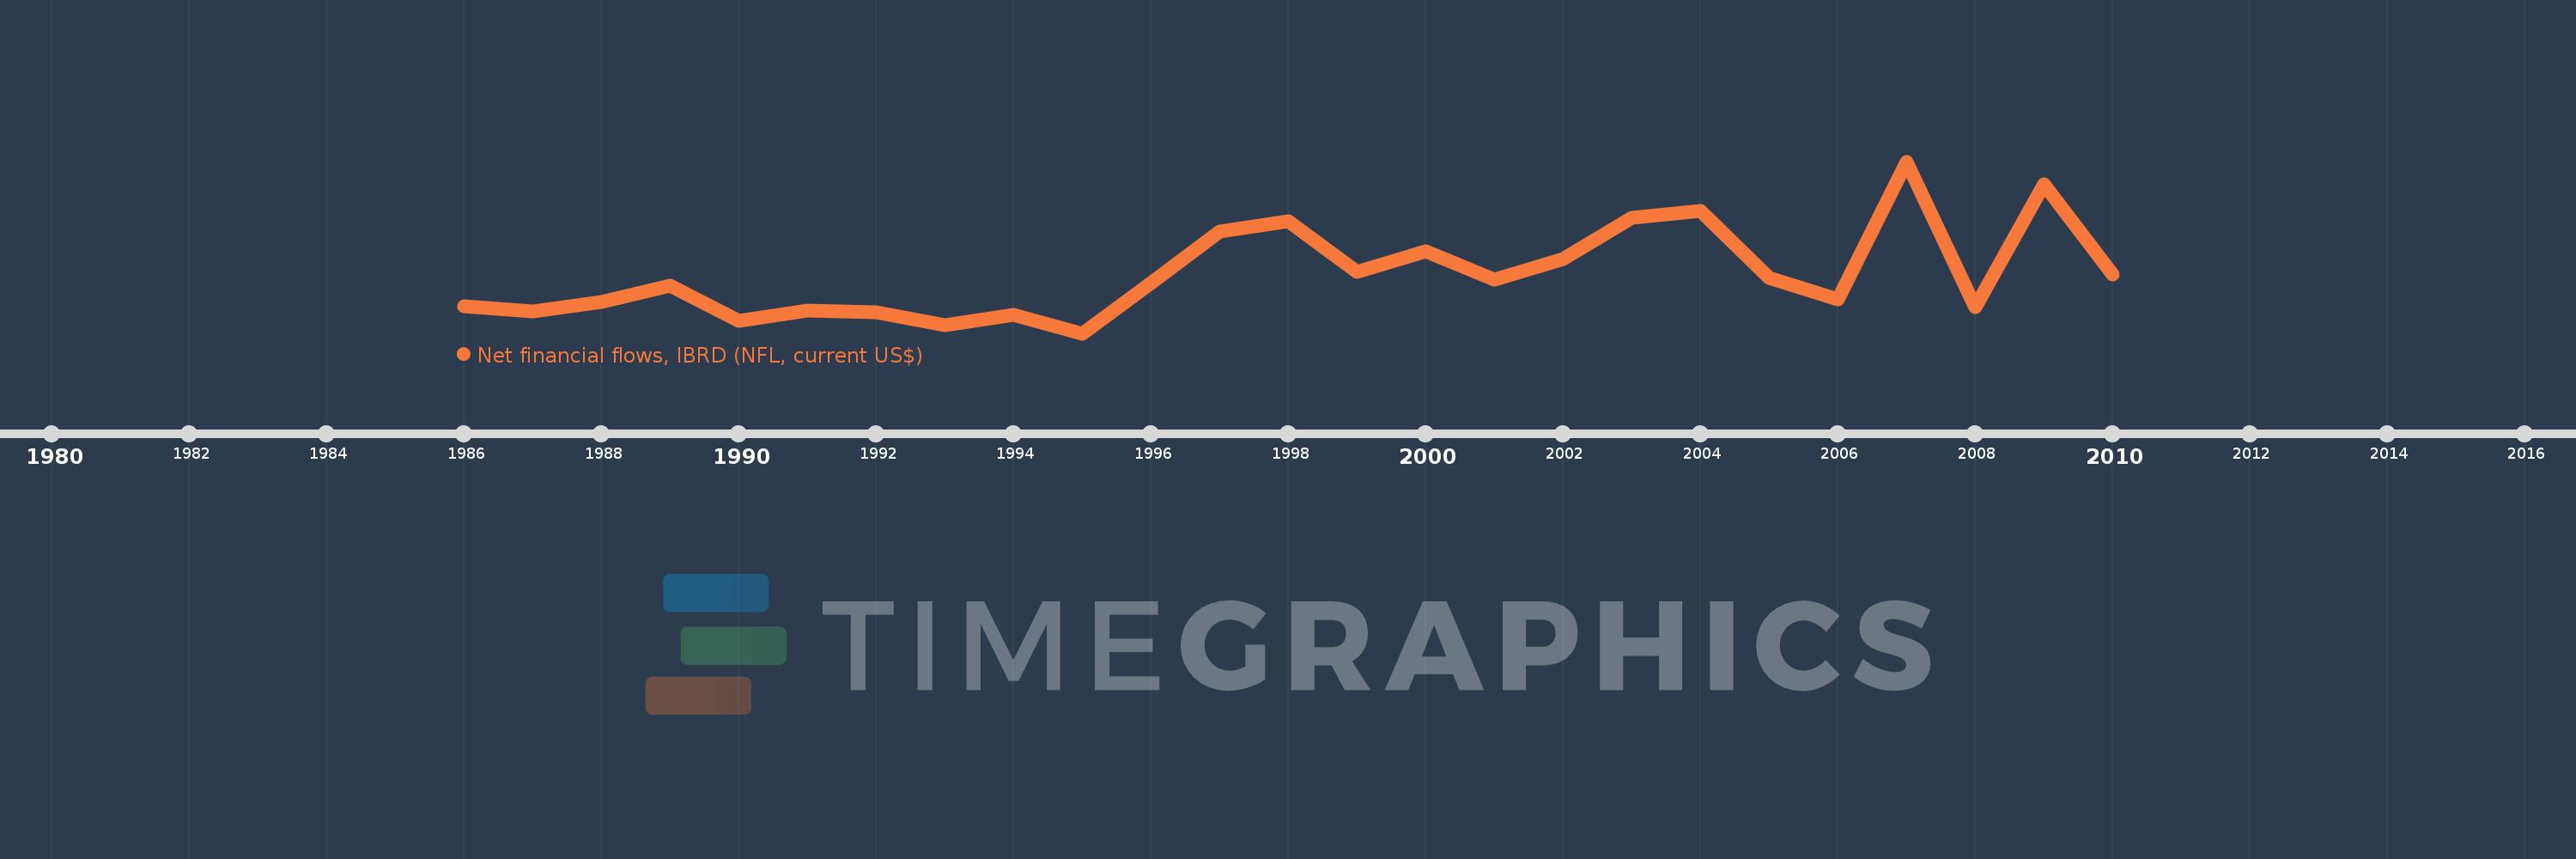
Net financial flows, IBRD (NFL, current US$)
2010,2009,2008,2007,2006,2005,2004,2003,2002,2001,2000,1999,1998,1997,1996,1995,1994,1993,1992,1991,1990,1989,1988,1987,1986
Queste statistiche in altri paesi:
Linea del tempo:
Questa scala temporale mostra un grafico dal 1986 anno al 2010 anno. Croatia. I dati fino ad 1985 anno non disponibili. Il numero di osservazioni attuali secondo i date: 25.
La fonte (nome):
Indicatori dello sviluppo mondiale
La fonte (organizzazione):
World Bank, International Debt Statistics.
Categorie:
External Debt
sono stati aggiornati
23 apr 2017 anni
Indicatori delle variazioni dei valori per anni
Minima:
-28.082 Mln
1 gen 1995 anni
Massimo:
169.489 Mln
1 gen 2007 anni
Alla data di osservazione
Valore
Variazione assoluta
La variazione rispetto al valore precedente
1 gen 1986 anni
2.592 Mln
+2.592 Mln
0.0%
1 gen 1987 anni
-2.715 Mln
-5.307 Mln
-204.73%
1 gen 1988 anni
7.658 Mln
+10.373 Mln
-382.07%
1 gen 1989 anni
27.086 Mln
+19.427 Mln
253.68%
1 gen 1990 anni
-13.521 Mln
-40.607 Mln
-149.92%
1 gen 1991 anni
-2.192 Mln
+11.329 Mln
-83.79%
1 gen 1992 anni
-3.77 Mln
-1.578 Mln
71.98%
1 gen 1993 anni
-18.405 Mln
-14.634 Mln
388.18%
1 gen 1994 anni
-6.614 Mln
+11.791 Mln
-64.06%
1 gen 1995 anni
-28.082 Mln
-21.468 Mln
324.59%
1 gen 1996 anni
29.352 Mln
+57.434 Mln
-204.52%
1 gen 1997 anni
88.903 Mln
+59.552 Mln
202.89%
1 gen 1998 anni
100.396 Mln
+11.493 Mln
12.93%
1 gen 1999 anni
42.127 Mln
-58.269 Mln
-58.04%
1 gen 2000 anni
66.628 Mln
+24.501 Mln
58.16%
1 gen 2001 anni
33.534 Mln
-33.094 Mln
-49.67%
1 gen 2002 anni
56.903 Mln
+23.369 Mln
69.69%
1 gen 2003 anni
104.774 Mln
+47.871 Mln
84.13%
1 gen 2004 anni
112.589 Mln
+7.815 Mln
7.46%
1 gen 2005 anni
35.946 Mln
-76.643 Mln
-68.07%
1 gen 2006 anni
11.018 Mln
-24.927 Mln
-69.35%
1 gen 2007 anni
169.489 Mln
+158.471 Mln
1.44 Mille.%
1 gen 2008 anni
2.283 Mln
-167.206 Mln
-98.65%
1 gen 2009 anni
143.025 Mln
+140.743 Mln
6.17 Mille.%
1 gen 2010 anni
39.757 Mln
-103.269 Mln
-72.2%
Classificazione dei paesi secondo i statistiche attuali per anni


Commenti: