29
/it/
it
AIzaSyAYiBZKx7MnpbEhh9jyipgxe19OcubqV5w
April 1, 2024
252195
St. Vincent and the Grenadines
VCT
true
2
1
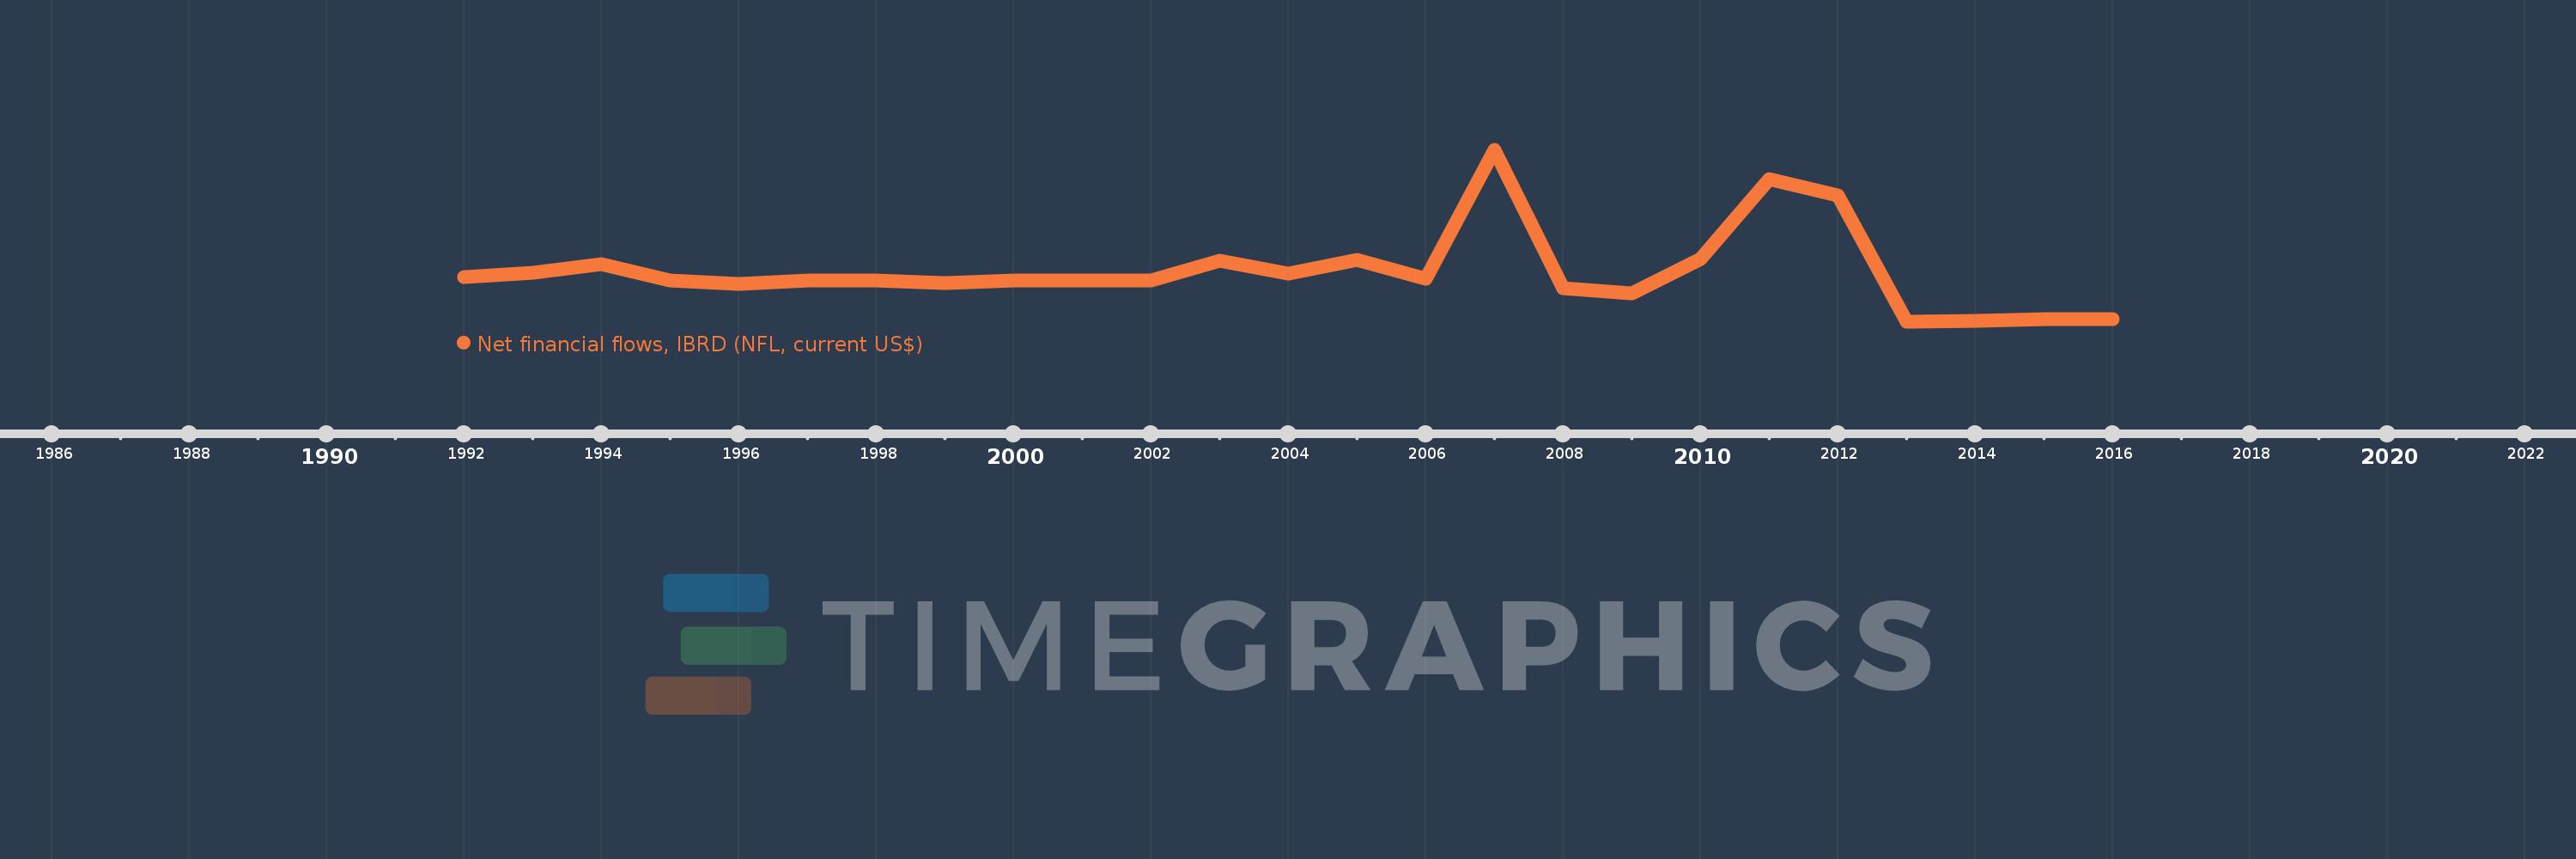
Net financial flows, IBRD (NFL, current US$)
2016,2015,2014,2013,2012,2011,2010,2009,2008,2007,2006,2005,2004,2003,2002,2001,2000,1999,1998,1997,1996,1995,1994,1993,1992
Queste statistiche in altri paesi:
Linea del tempo:
Questa scala temporale mostra un grafico dal 1992 anno al 2016 anno. St. Vincent and the Grenadines. I dati fino ad 1991 anno non disponibili. Il numero di osservazioni attuali secondo i date: 25.
La fonte (nome):
Indicatori dello sviluppo mondiale
La fonte (organizzazione):
World Bank, International Debt Statistics.
Categorie:
External Debt
sono stati aggiornati
23 apr 2017 anni
Indicatori delle variazioni dei valori per anni
Minima:
-814.0 Mille.
1 gen 2013 anni
Massimo:
2.443 Mln
1 gen 2007 anni
Alla data di osservazione
Valore
Variazione assoluta
La variazione rispetto al valore precedente
1 gen 1992 anni
43.0 Mille.
+43.0 Mille.
0.0%
1 gen 1993 anni
120.0 Mille.
+77.0 Mille.
179.07%
1 gen 1994 anni
288.0 Mille.
+168.0 Mille.
140.0%
1 gen 1995 anni
-20.0 Mille.
-308.0 Mille.
-106.94%
1 gen 1996 anni
-89.0 Mille.
-69.0 Mille.
345.0%
1 gen 1997 anni
-24.0 Mille.
+65.0 Mille.
-73.03%
1 gen 1998 anni
-26.0 Mille.
-2.0 Mille.
8.33%
1 gen 1999 anni
-69.0 Mille.
-43.0 Mille.
165.38%
1 gen 2000 anni
-30.0 Mille.
+39.0 Mille.
-56.52%
1 gen 2001 anni
-30.0 Mille.
0.0
0.0%
1 gen 2002 anni
-28.0 Mille.
+2.0 Mille.
-6.67%
1 gen 2003 anni
343.0 Mille.
+371.0 Mille.
-1.32 Mille.%
1 gen 2004 anni
102.0 Mille.
-241.0 Mille.
-70.26%
1 gen 2005 anni
360.0 Mille.
+258.0 Mille.
252.94%
1 gen 2006 anni
1000.0
-359.0 Mille.
-99.72%
1 gen 2007 anni
2.443 Mln
+2.442 Mln
244.2 Mille.%
1 gen 2008 anni
-172.0 Mille.
-2.615 Mln
-107.04%
1 gen 2009 anni
-268.0 Mille.
-96.0 Mille.
55.81%
1 gen 2010 anni
375.0 Mille.
+643.0 Mille.
-239.93%
1 gen 2011 anni
1.899 Mln
+1.524 Mln
406.4%
1 gen 2012 anni
1.582 Mln
-317.0 Mille.
-16.69%
1 gen 2013 anni
-814.0 Mille.
-2.396 Mln
-151.45%
1 gen 2014 anni
-794.0 Mille.
+20.0 Mille.
-2.46%
1 gen 2015 anni
-754.0 Mille.
+40.0 Mille.
-5.04%
1 gen 2016 anni
-754.0 Mille.
0.0
0.0%
Classificazione dei paesi secondo i statistiche attuali per anni


Commenti: