29
/it/
it
AIzaSyAYiBZKx7MnpbEhh9jyipgxe19OcubqV5w
April 1, 2024
238544
Seychelles
SYC
true
2
1
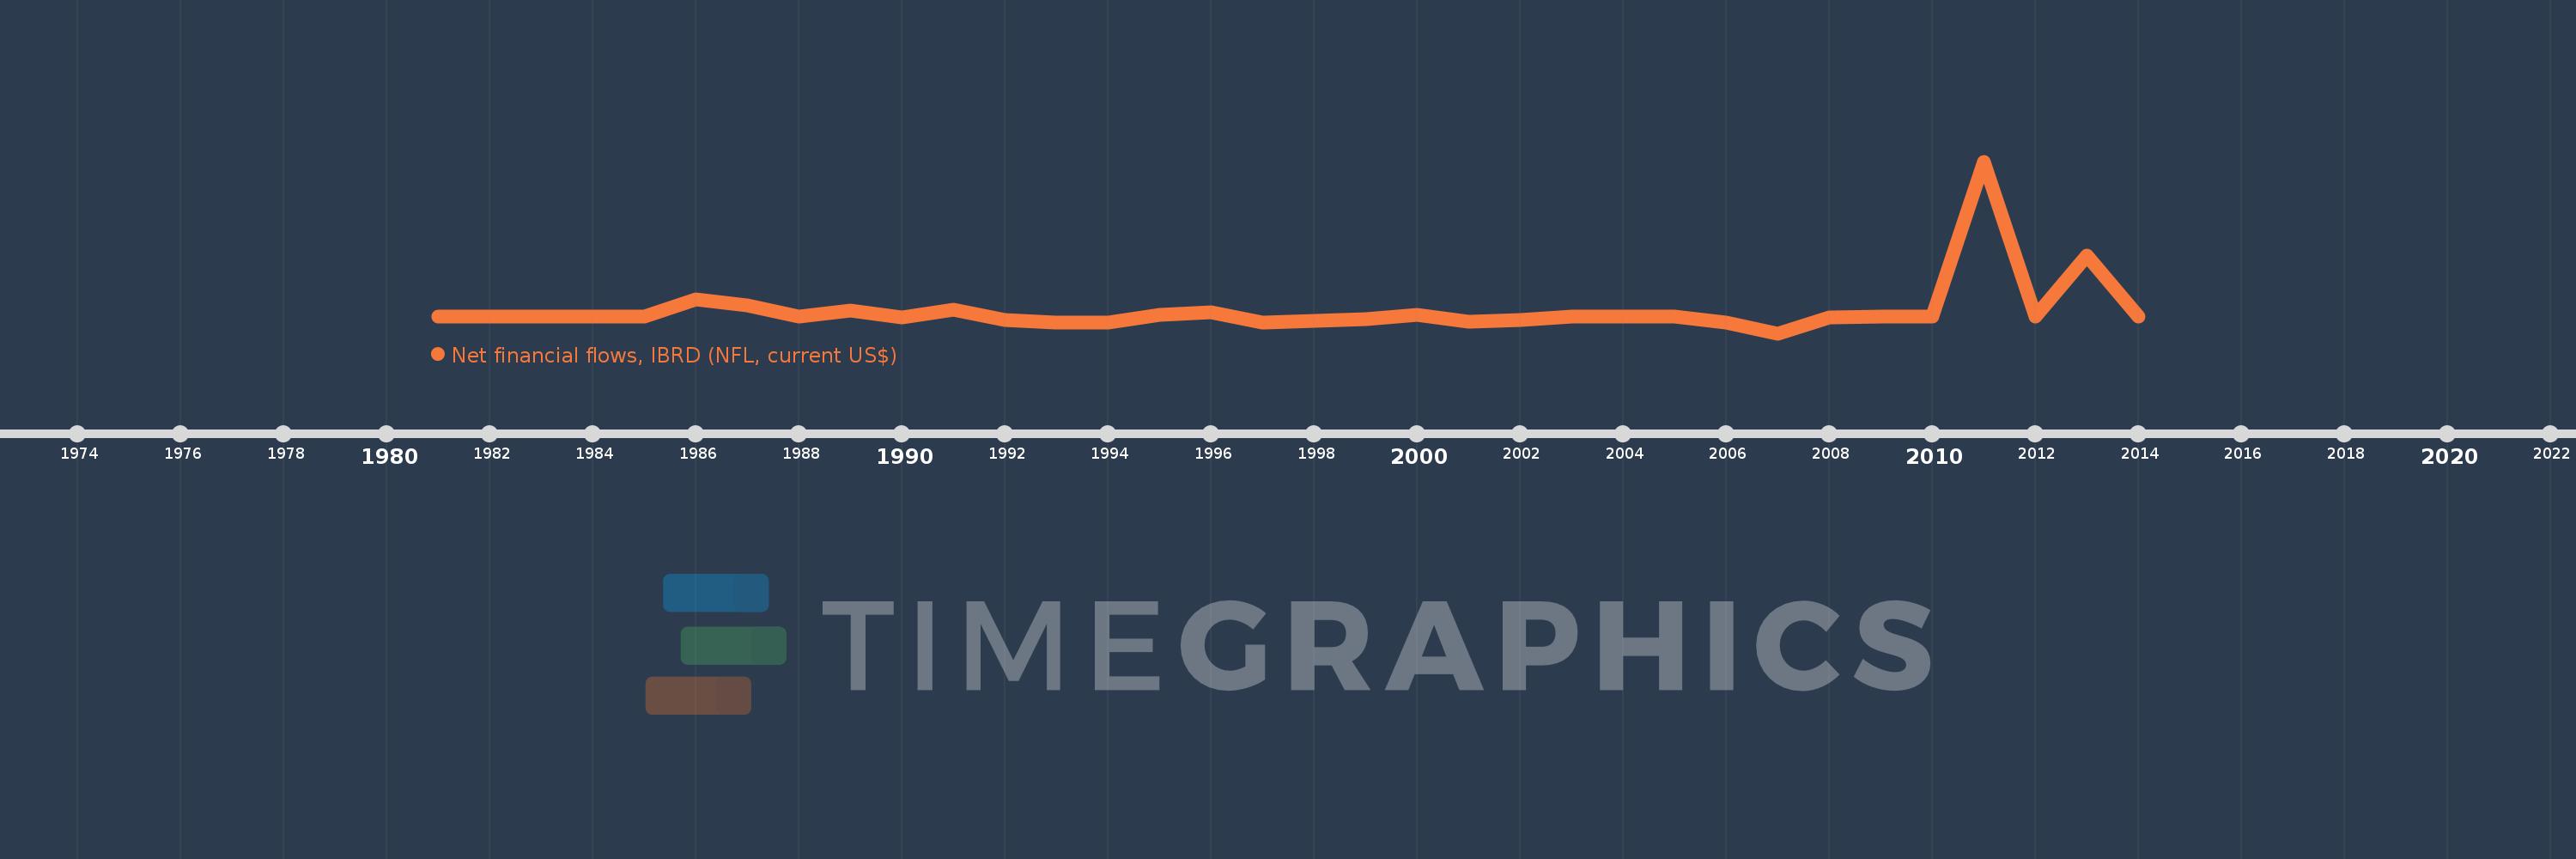
Net financial flows, IBRD (NFL, current US$)
2014,2013,2012,2011,2010,2009,2008,2007,2006,2005,2004,2003,2002,2001,2000,1999,1998,1997,1996,1995,1994,1993,1992,1991,1990,1989,1988,1987,1986,1985,1984,1983,1982,1981
Queste statistiche in altri paesi:
Linea del tempo:
Questa scala temporale mostra un grafico dal 1981 anno al 2014 anno. Seychelles. I dati fino ad 1980 anno non disponibili. Il numero di osservazioni attuali secondo i date: 34.
La fonte (nome):
Indicatori dello sviluppo mondiale
La fonte (organizzazione):
World Bank, International Debt Statistics.
Categorie:
External Debt
sono stati aggiornati
23 apr 2017 anni
Indicatori delle variazioni dei valori per anni
Minima:
-1.899 Mln
1 gen 2007 anni
Massimo:
17.675 Mln
1 gen 2011 anni
Alla data di osservazione
Valore
Variazione assoluta
La variazione rispetto al valore precedente
1 gen 1981 anni
0.0
0.0
0.0%
1 gen 1986 anni
2.005 Mln
+2.005 Mln
%
1 gen 1987 anni
1.235 Mln
-770.0 Mille.
-38.4%
1 gen 1988 anni
0.0
-1.235 Mln
-100.0%
1 gen 1989 anni
720.0 Mille.
+720.0 Mille.
%
1 gen 1990 anni
-88.0 Mille.
-808.0 Mille.
-112.22%
1 gen 1991 anni
793.0 Mille.
+881.0 Mille.
-1.0 Mille.%
1 gen 1992 anni
-358.0 Mille.
-1.151 Mln
-145.15%
1 gen 1993 anni
-674.0 Mille.
-316.0 Mille.
88.27%
1 gen 1994 anni
-631.0 Mille.
+43.0 Mille.
-6.38%
1 gen 1995 anni
245.0 Mille.
+876.0 Mille.
-138.83%
1 gen 1996 anni
506.0 Mille.
+261.0 Mille.
106.53%
1 gen 1997 anni
-645.0 Mille.
-1.151 Mln
-227.47%
1 gen 1998 anni
-442.0 Mille.
+203.0 Mille.
-31.47%
1 gen 1999 anni
-252.0 Mille.
+190.0 Mille.
-42.99%
1 gen 2000 anni
164.0 Mille.
+416.0 Mille.
-165.08%
1 gen 2001 anni
-597.0 Mille.
-761.0 Mille.
-464.02%
1 gen 2002 anni
-381.0 Mille.
+216.0 Mille.
-36.18%
1 gen 2003 anni
0.0
+381.0 Mille.
-100.0%
1 gen 2004 anni
-35.0 Mille.
-35.0 Mille.
%
1 gen 2005 anni
0.0
+35.0 Mille.
-100.0%
1 gen 2006 anni
-716.0 Mille.
-716.0 Mille.
%
1 gen 2007 anni
-1.899 Mln
-1.183 Mln
165.22%
1 gen 2008 anni
-43.0 Mille.
+1.856 Mln
-97.74%
1 gen 2009 anni
0.0
+43.0 Mille.
-100.0%
1 gen 2011 anni
17.675 Mln
+17.675 Mln
%
1 gen 2012 anni
0.0
-17.675 Mln
-100.0%
1 gen 2013 anni
7.0 Mln
+7.0 Mln
%
1 gen 2014 anni
19.0 Mille.
-6.981 Mln
-99.73%
Classificazione dei paesi secondo i statistiche attuali per anni


Commenti: