29
/de/
de
AIzaSyAYiBZKx7MnpbEhh9jyipgxe19OcubqV5w
April 1, 2024
238544
Seychelles
SYC
true
2
1
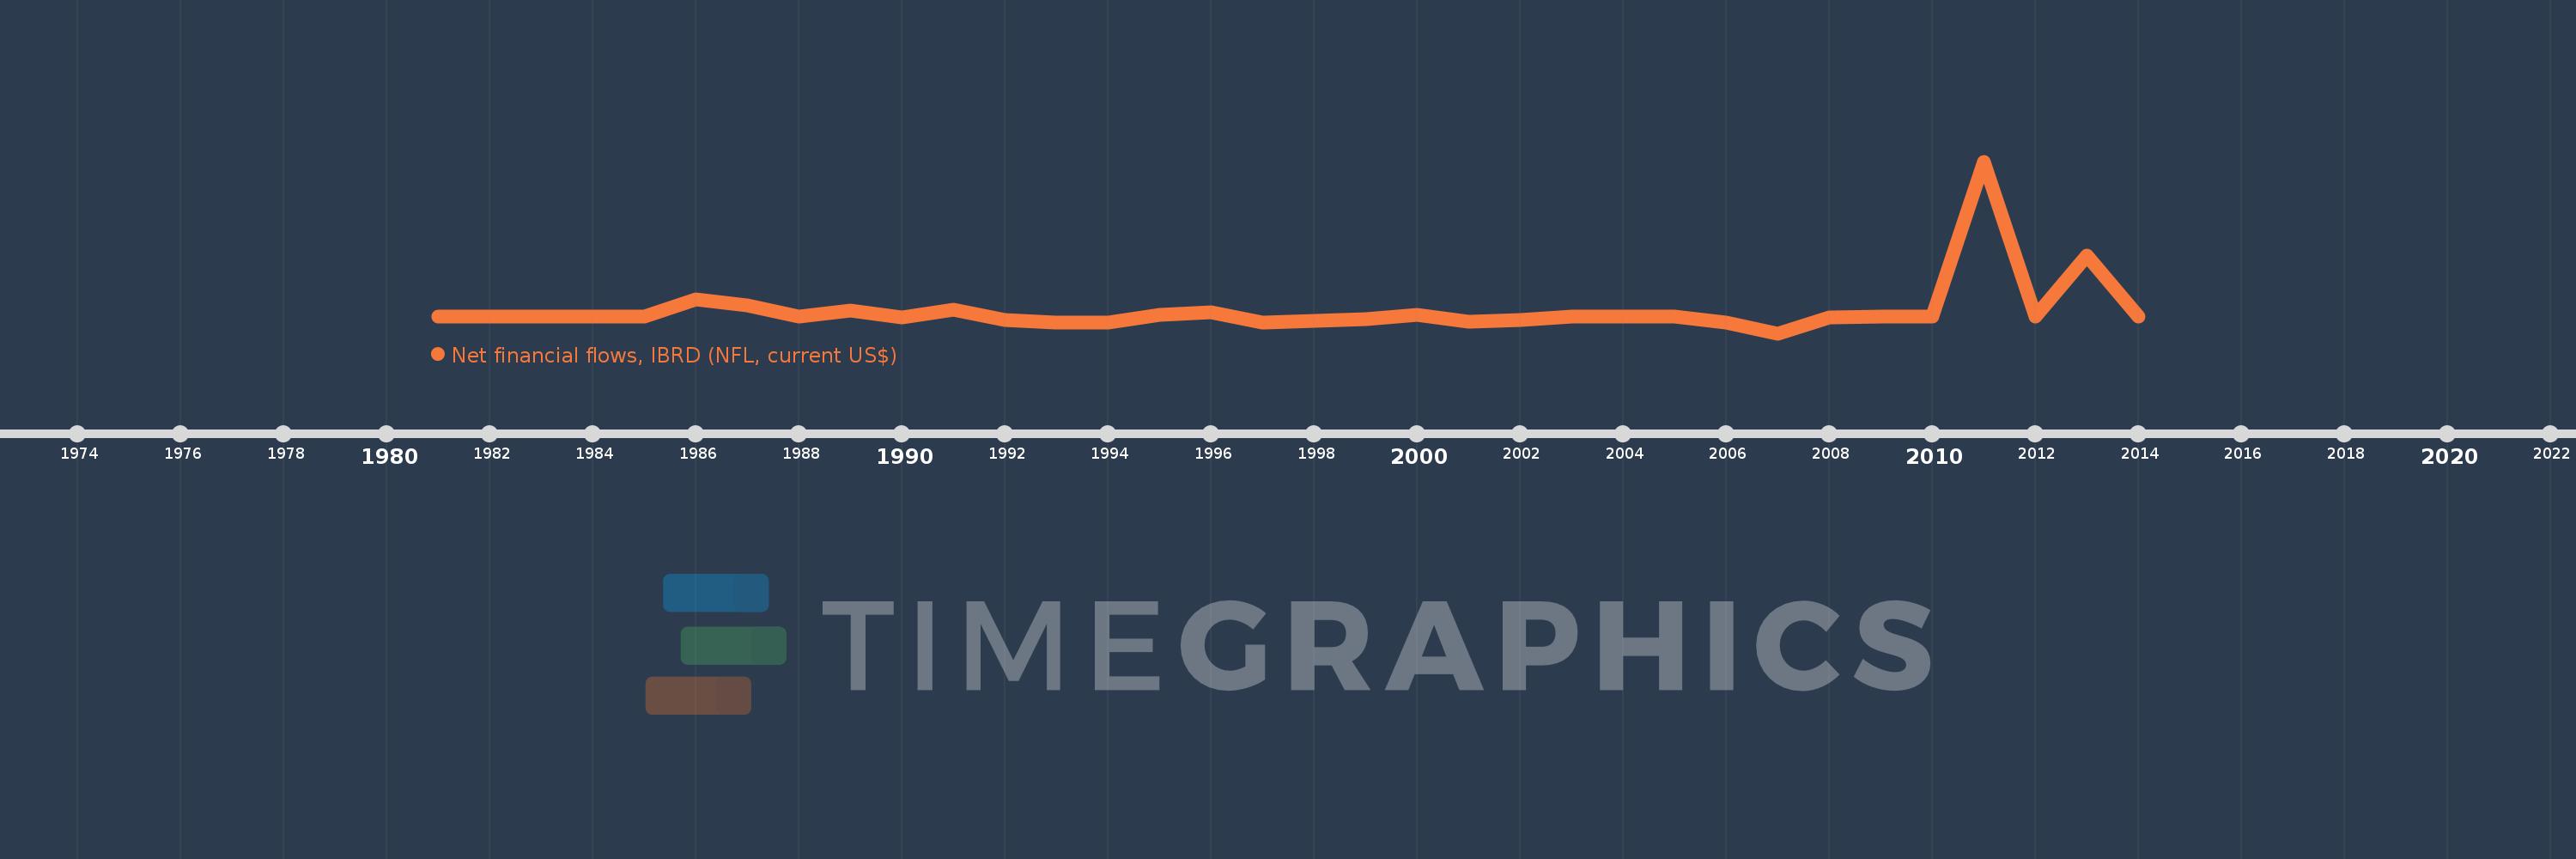
Net financial flows, IBRD (NFL, current US$)
2014,2013,2012,2011,2010,2009,2008,2007,2006,2005,2004,2003,2002,2001,2000,1999,1998,1997,1996,1995,1994,1993,1992,1991,1990,1989,1988,1987,1986,1985,1984,1983,1982,1981
Diese Statistik in anderen Ländern:
Zeitlinie:
Diese Zeitleiste vorliegt die Graphik ab 1981 J. bis 2014 J. Seychelles. Die Angaben bis 1980 J. sind nicht vorhanden. Die Zahl aktueller Beobachtungen nach Daten: 34.
Die Quelle (Bezeichnung):
Kennzahlen der Weltentwicklung
Die Quelle (Einrichtung):
World Bank, International Debt Statistics.
Kategorien:
External Debt
Es wurde aktualisiert:
23 Apr 2017 Jahr
Kennzahlen der Wertänderungen vom Jahr zum Jahr
im Durchschnitt:
694.147 Tsnd.
Minimum:
-1.899 Mln.
1 Jan 2007 Jahr
Maximum:
17.675 Mln.
1 Jan 2011 Jahr
Zum Datum der Beobachtung
Wert
Absolute Veränderung
Die Veränderung bezüglich dem vorherigen Wert
1 Jan 1981 Jahr
0.0
0.0
0.0%
1 Jan 1986 Jahr
2.005 Mln.
+2.005 Mln.
%
1 Jan 1987 Jahr
1.235 Mln.
-770.0 Tsnd.
-38.4%
1 Jan 1988 Jahr
0.0
-1.235 Mln.
-100.0%
1 Jan 1989 Jahr
720.0 Tsnd.
+720.0 Tsnd.
%
1 Jan 1990 Jahr
-88.0 Tsnd.
-808.0 Tsnd.
-112.22%
1 Jan 1991 Jahr
793.0 Tsnd.
+881.0 Tsnd.
-1.0 Tsnd.%
1 Jan 1992 Jahr
-358.0 Tsnd.
-1.151 Mln.
-145.15%
1 Jan 1993 Jahr
-674.0 Tsnd.
-316.0 Tsnd.
88.27%
1 Jan 1994 Jahr
-631.0 Tsnd.
+43.0 Tsnd.
-6.38%
1 Jan 1995 Jahr
245.0 Tsnd.
+876.0 Tsnd.
-138.83%
1 Jan 1996 Jahr
506.0 Tsnd.
+261.0 Tsnd.
106.53%
1 Jan 1997 Jahr
-645.0 Tsnd.
-1.151 Mln.
-227.47%
1 Jan 1998 Jahr
-442.0 Tsnd.
+203.0 Tsnd.
-31.47%
1 Jan 1999 Jahr
-252.0 Tsnd.
+190.0 Tsnd.
-42.99%
1 Jan 2000 Jahr
164.0 Tsnd.
+416.0 Tsnd.
-165.08%
1 Jan 2001 Jahr
-597.0 Tsnd.
-761.0 Tsnd.
-464.02%
1 Jan 2002 Jahr
-381.0 Tsnd.
+216.0 Tsnd.
-36.18%
1 Jan 2003 Jahr
0.0
+381.0 Tsnd.
-100.0%
1 Jan 2004 Jahr
-35.0 Tsnd.
-35.0 Tsnd.
%
1 Jan 2005 Jahr
0.0
+35.0 Tsnd.
-100.0%
1 Jan 2006 Jahr
-716.0 Tsnd.
-716.0 Tsnd.
%
1 Jan 2007 Jahr
-1.899 Mln.
-1.183 Mln.
165.22%
1 Jan 2008 Jahr
-43.0 Tsnd.
+1.856 Mln.
-97.74%
1 Jan 2009 Jahr
0.0
+43.0 Tsnd.
-100.0%
1 Jan 2011 Jahr
17.675 Mln.
+17.675 Mln.
%
1 Jan 2012 Jahr
0.0
-17.675 Mln.
-100.0%
1 Jan 2013 Jahr
7.0 Mln.
+7.0 Mln.
%
1 Jan 2014 Jahr
19.0 Tsnd.
-6.981 Mln.
-99.73%
Bewertung der Länder gemäß mit laufender Statistik nach Jahren


Kommentare: