29
/it/
it
AIzaSyAYiBZKx7MnpbEhh9jyipgxe19OcubqV5w
April 1, 2024
28414
East Asia & Pacific (excluding high income)
EAP
false
2
1
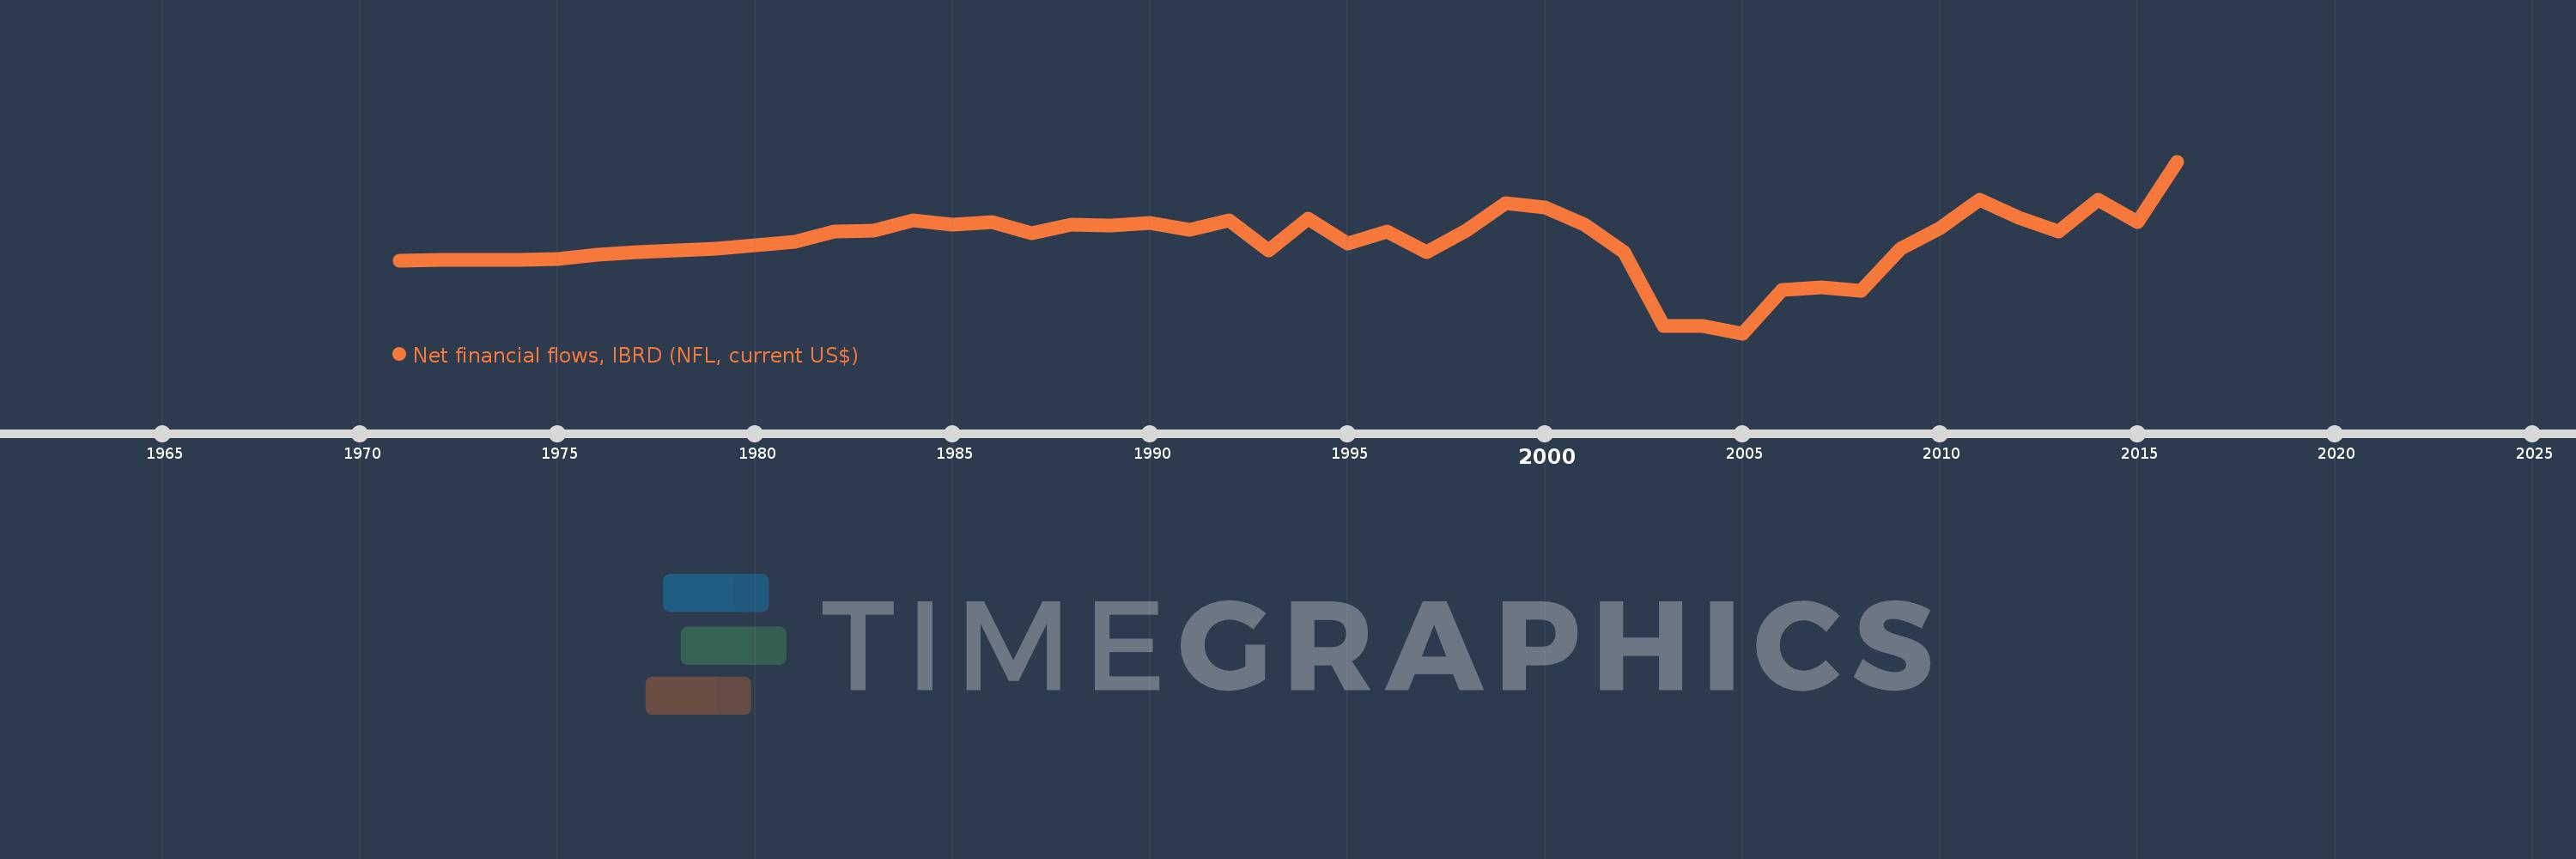
Net financial flows, IBRD (NFL, current US$)
2016,2015,2014,2013,2012,2011,2010,2009,2008,2007,2006,2005,2004,2003,2002,2001,2000,1999,1998,1997,1996,1995,1994,1993,1992,1991,1990,1989,1988,1987,1986,1985,1984,1983,1982,1981,1980,1979,1978,1977,1976,1975,1974,1973,1972,1971
Queste statistiche in altri paesi:
Linea del tempo:
Questa scala temporale mostra un grafico dal 1971 anno al 2016 anno. East Asia & Pacific (excluding high income). I dati fino ad 1970 anno non disponibili. Il numero di osservazioni attuali secondo i date: 46.
La fonte (nome):
Indicatori dello sviluppo mondiale
La fonte (organizzazione):
World Bank, International Debt Statistics.
Categorie:
External Debt
sono stati aggiornati
23 apr 2017 anni
Indicatori delle variazioni dei valori per anni
Minima:
-2.446 Mlrd
1 gen 2005 anni
Massimo:
3.392 Mlrd
1 gen 2016 anni
Alla data di osservazione
Valore
Variazione assoluta
La variazione rispetto al valore precedente
1 gen 1971 anni
35.06 Mln
+35.06 Mln
0.0%
1 gen 1972 anni
35.915 Mln
+855.0 Mille.
2.44%
1 gen 1973 anni
58.281 Mln
+22.366 Mln
62.27%
1 gen 1974 anni
57.821 Mln
-460.0 Mille.
-0.79%
1 gen 1975 anni
89.959 Mln
+32.138 Mln
55.58%
1 gen 1976 anni
216.058 Mln
+126.099 Mln
140.17%
1 gen 1977 anni
302.863 Mln
+86.805 Mln
40.18%
1 gen 1978 anni
359.22 Mln
+56.357 Mln
18.61%
1 gen 1979 anni
440.733 Mln
+81.513 Mln
22.69%
1 gen 1980 anni
548.449 Mln
+107.716 Mln
24.44%
1 gen 1981 anni
674.591 Mln
+126.142 Mln
23.0%
1 gen 1982 anni
1.015 Mlrd
+340.858 Mln
50.53%
1 gen 1983 anni
1.041 Mlrd
+25.184 Mln
2.48%
1 gen 1984 anni
1.397 Mlrd
+356.167 Mln
34.23%
1 gen 1985 anni
1.235 Mlrd
-162.147 Mln
-11.61%
1 gen 1986 anni
1.327 Mlrd
+92.555 Mln
7.5%
1 gen 1987 anni
957.052 Mln
-370.156 Mln
-27.89%
1 gen 1988 anni
1.236 Mlrd
+279.425 Mln
29.2%
1 gen 1989 anni
1.221 Mlrd
-15.094 Mln
-1.22%
1 gen 1990 anni
1.301 Mlrd
+79.287 Mln
6.49%
1 gen 1991 anni
1.07 Mlrd
-230.277 Mln
-17.7%
1 gen 1992 anni
1.38 Mlrd
+309.798 Mln
28.94%
1 gen 1993 anni
379.884 Mln
-1.0 Mlrd
-72.48%
1 gen 1994 anni
1.449 Mlrd
+1.069 Mlrd
281.38%
1 gen 1995 anni
613.061 Mln
-835.757 Mln
-57.69%
1 gen 1996 anni
1.016 Mlrd
+403.0 Mln
65.74%
1 gen 1997 anni
313.642 Mln
-702.419 Mln
-69.13%
1 gen 1998 anni
1.05 Mlrd
+735.926 Mln
234.64%
1 gen 1999 anni
1.974 Mlrd
+924.512 Mln
88.09%
1 gen 2000 anni
1.825 Mlrd
-148.864 Mln
-7.54%
1 gen 2001 anni
1.239 Mlrd
-585.818 Mln
-32.1%
1 gen 2002 anni
308.903 Mln
-930.495 Mln
-75.08%
1 gen 2003 anni
-2.211 Mlrd
-2.519 Mlrd
-815.63%
1 gen 2004 anni
-2.202 Mlrd
+8.164 Mln
-0.37%
1 gen 2005 anni
-2.446 Mlrd
-243.349 Mln
11.05%
1 gen 2006 anni
-973.098 Mln
+1.473 Mlrd
-60.21%
1 gen 2007 anni
-878.277 Mln
+94.821 Mln
-9.74%
1 gen 2008 anni
-989.126 Mln
-110.849 Mln
12.62%
1 gen 2009 anni
424.842 Mln
+1.414 Mlrd
-142.95%
1 gen 2010 anni
1.127 Mlrd
+701.795 Mln
165.19%
1 gen 2011 anni
2.081 Mlrd
+954.518 Mln
84.72%
1 gen 2012 anni
1.492 Mlrd
-588.86 Mln
-28.29%
1 gen 2013 anni
1.003 Mlrd
-489.524 Mln
-32.8%
1 gen 2014 anni
2.095 Mlrd
+1.092 Mlrd
108.91%
1 gen 2015 anni
1.327 Mlrd
-767.608 Mln
-36.64%
1 gen 2016 anni
3.392 Mlrd
+2.065 Mlrd
155.57%
Classificazione dei paesi secondo i statistiche attuali per anni


Commenti: