29
/es/
es
AIzaSyAYiBZKx7MnpbEhh9jyipgxe19OcubqV5w
April 1, 2024
97885
Cabo Verde
CPV
true
2
1
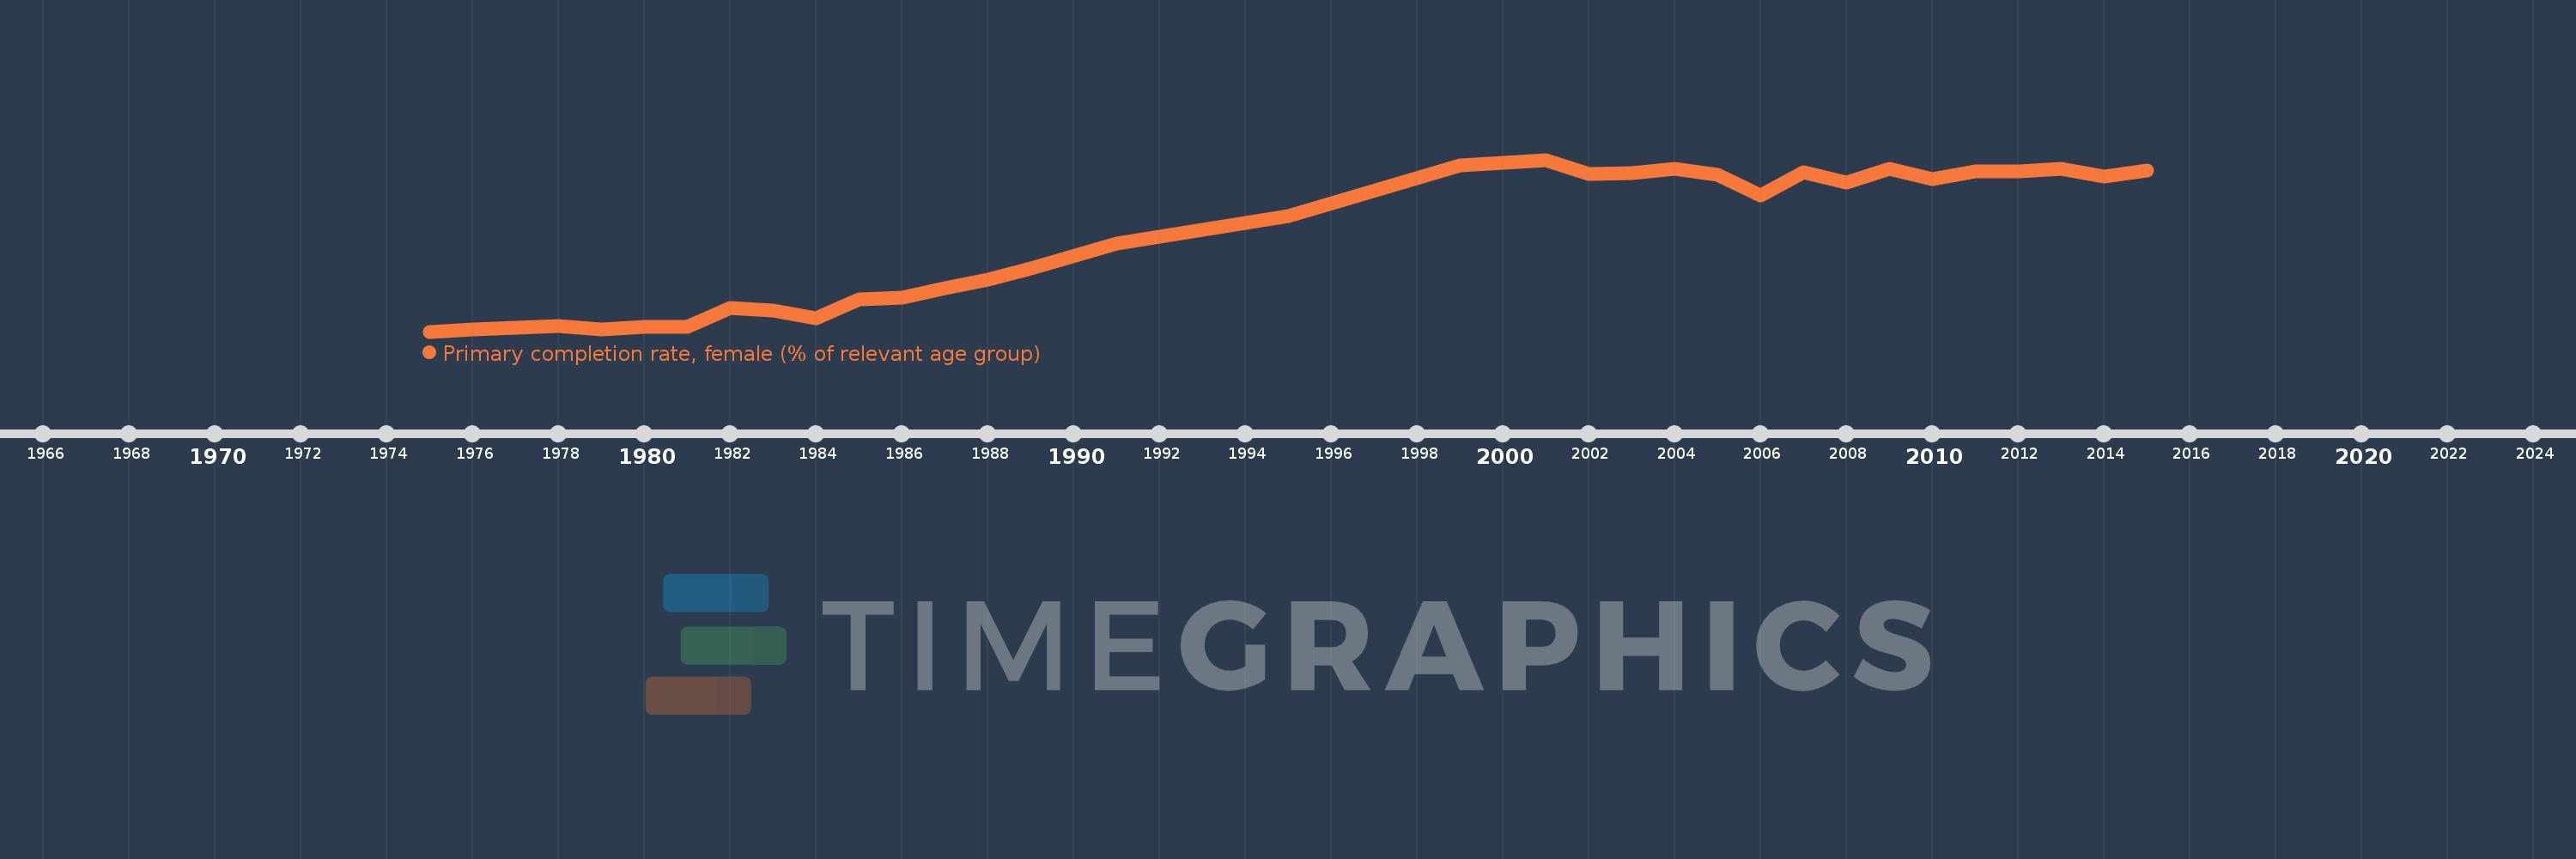
Primary completion rate, female (% of relevant age group)
2015,2014,2013,2012,2011,2010,2009,2008,2007,2006,2005,2004,2003,2002,2001,1999,1995,1991,1989,1988,1987,1986,1985,1984,1983,1982,1981,1980,1979,1978,1976,1975
Estas estadísticas en otros países:
AfghanistanAlbaniaAlgeriaAngolaAntigua and BarbudaArab WorldArgentinaArmeniaArubaAustriaAzerbaijanBahamas, TheBahrainBangladeshBarbadosBelarusBelgiumBelizeBeninBermudaBhutanBoliviaBosnia and HerzegovinaBotswanaBrunei DarussalamBulgariaBurkina FasoBurundiCabo VerdeCambodiaCameroonCanadaCaribbean small statesCentral African RepublicCentral Europe and the BalticsChadChileChinaColombiaComorosCongo, Dem. Rep.Congo, Rep.Costa RicaCote d'IvoireCroatiaCubaCyprusCzech RepublicDenmarkDjiboutiDominicaDominican RepublicEarly-demographic dividendEast Asia & PacificEast Asia & Pacific (excluding high income)East Asia & Pacific (IDA & IBRD countries)EcuadorEgypt, Arab Rep.El SalvadorEquatorial GuineaEritreaEstoniaEthiopiaEuro areaEurope & Central AsiaEurope & Central Asia (excluding high income)Europe & Central Asia (IDA & IBRD countries)European UnionFijiFinlandFragile and conflict affected situationsFranceGabonGambia, TheGeorgiaGermanyGhanaGreeceGrenadaGuatemalaGuineaGuinea-BissauGuyanaHaitiHeavily indebted poor countries (HIPC)High incomeHondurasHong Kong SAR, ChinaHungaryIBRD onlyIcelandIDA & IBRD totalIDA blendIDA onlyIDA totalIndiaIndonesiaIran, Islamic Rep.IraqIrelandIsraelItalyJamaicaJapanJordanKazakhstanKenyaKiribatiKorea, Dem. People’s Rep.Korea, Rep.KuwaitKyrgyz RepublicLao PDRLate-demographic dividendLatin America & Caribbean Latin America & Caribbean (excluding high income)Latin America & the Caribbean (IDA & IBRD countries)LatviaLeast developed countries: UN classificationLebanonLesothoLiberiaLibyaLiechtensteinLithuaniaLow & middle incomeLow incomeLower middle incomeLuxembourgMacao SAR, ChinaMacedonia, FYRMadagascarMalawiMaldivesMaliMaltaMarshall IslandsMauritaniaMauritiusMexicoMiddle East & North AfricaMiddle East & North Africa (excluding high income)Middle East & North Africa (IDA & IBRD countries)Middle incomeMoldovaMongoliaMontenegroMoroccoMozambiqueMyanmarNamibiaNauruNepalNetherlandsNew ZealandNicaraguaNigerNigeriaNorwayOECD membersOmanOther small statesPacific island small statesPakistanPalauPanamaPapua New GuineaParaguayPeruPhilippinesPolandPortugalPost-demographic dividendPre-demographic dividendQatarRomaniaRussian FederationRwandaSamoaSan MarinoSao Tome and PrincipeSaudi ArabiaSenegalSerbiaSeychellesSierra LeoneSlovak RepublicSloveniaSmall statesSolomon IslandsSouth AfricaSouth AsiaSouth Asia (IDA & IBRD)South SudanSpainSri LankaSt. Kitts and NevisSt. LuciaSt. Vincent and the GrenadinesSub-Saharan Africa Sub-Saharan Africa (excluding high income)Sub-Saharan Africa (IDA & IBRD countries)SudanSurinameSwazilandSwedenSwitzerlandSyrian Arab RepublicTajikistanTanzaniaThailandTimor-LesteTogoTongaTrinidad and TobagoTunisiaTurkeyTuvaluUgandaUkraineUnited Arab EmiratesUpper middle incomeUruguayUzbekistanVanuatuVenezuela, RBVietnamWest Bank and GazaWorldYemen, Rep.ZambiaZimbabwe línea de tiempo (timeline):
En esta escala de tiempo se presenta un gráfico de 1975 y 2015 de Cabo Verde. Los datos de 1974 están ausentes. El número de observaciones reales por fecha: 32.
Fuente (nombre):
Indicadores del desarrollo mundial
Fuente (organización):
United Nations Educational, Scientific, and Cultural Organization (UNESCO) Institute for Statistics.
Categorías:
Education, Gender
Se ha actualizado:
23 abr 2017 año
Los indicadores de los cambios de valor en los últimos años
Mínimo:
12.441
1 ene 1975 año
Máximo:
104.076
1 ene 2001 año
A la fecha de observación
Valor
Cambio absoluto
El cambio con respecto al valor anterior
1 ene 1975 año
12.441
+12.441
0.0%
1 ene 1976 año
13.703
+1.263
10.15%
1 ene 1978 año
15.218
+1.515
11.06%
1 ene 1979 año
13.541
-1.677
-11.02%
1 ene 1980 año
14.937
+1.396
10.31%
1 ene 1981 año
14.951
+0.014
0.09%
1 ene 1982 año
25.083
+10.132
67.77%
1 ene 1983 año
23.834
-1.249
-4.98%
1 ene 1984 año
19.506
-4.328
-18.16%
1 ene 1985 año
29.844
+10.338
53.0%
1 ene 1986 año
30.433
+0.589
1.97%
1 ene 1987 año
35.62
+5.187
17.05%
1 ene 1988 año
40.138
+4.518
12.69%
1 ene 1989 año
46.235
+6.096
15.19%
1 ene 1991 año
59.581
+13.347
28.87%
1 ene 1995 año
73.942
+14.361
24.1%
1 ene 1999 año
101.297
+27.355
36.99%
1 ene 2001 año
104.076
+2.779
2.74%
1 ene 2002 año
96.455
-7.621
-7.32%
1 ene 2003 año
97.2
+0.746
0.77%
1 ene 2004 año
99.474
+2.273
2.34%
1 ene 2005 año
95.955
-3.519
-3.54%
1 ene 2006 año
85.036
-10.918
-11.38%
1 ene 2007 año
97.339
+12.303
14.47%
1 ene 2008 año
91.934
-5.405
-5.55%
1 ene 2009 año
99.048
+7.114
7.74%
1 ene 2010 año
93.804
-5.244
-5.29%
1 ene 2011 año
97.872
+4.068
4.34%
1 ene 2012 año
97.891
+0.019
0.02%
1 ene 2013 año
99.281
+1.39
1.42%
1 ene 2014 año
95.225
-4.056
-4.09%
1 ene 2015 año
98.133
+2.908
3.05%
Ranking de los países por los datos estadísticos actuales


Comentarios: