29
/es/
es
AIzaSyAYiBZKx7MnpbEhh9jyipgxe19OcubqV5w
April 1, 2024
37723
IDA & IBRD total
IBT
false
2
1
Primary completion rate, female (% of relevant age group)
2015,2014,2013,2012,2011,2010,2009,2008,2007,2006,2005,2004,2003,2002,2001,2000,1999,1998,1997,1996,1995,1994,1993,1992,1991,1990,1989,1988,1987,1986,1985,1984,1983,1982,1981,1980,1979,1978,1977,1976,1975
Estas estadísticas en otros países:
AfghanistanAlbaniaAlgeriaAngolaAntigua and BarbudaArab WorldArgentinaArmeniaArubaAustriaAzerbaijanBahamas, TheBahrainBangladeshBarbadosBelarusBelgiumBelizeBeninBermudaBhutanBoliviaBosnia and HerzegovinaBotswanaBrunei DarussalamBulgariaBurkina FasoBurundiCabo VerdeCambodiaCameroonCanadaCaribbean small statesCentral African RepublicCentral Europe and the BalticsChadChileChinaColombiaComorosCongo, Dem. Rep.Congo, Rep.Costa RicaCote d'IvoireCroatiaCubaCyprusCzech RepublicDenmarkDjiboutiDominicaDominican RepublicEarly-demographic dividendEast Asia & PacificEast Asia & Pacific (excluding high income)East Asia & Pacific (IDA & IBRD countries)EcuadorEgypt, Arab Rep.El SalvadorEquatorial GuineaEritreaEstoniaEthiopiaEuro areaEurope & Central AsiaEurope & Central Asia (excluding high income)Europe & Central Asia (IDA & IBRD countries)European UnionFijiFinlandFragile and conflict affected situationsFranceGabonGambia, TheGeorgiaGermanyGhanaGreeceGrenadaGuatemalaGuineaGuinea-BissauGuyanaHaitiHeavily indebted poor countries (HIPC)High incomeHondurasHong Kong SAR, ChinaHungaryIBRD onlyIcelandIDA & IBRD totalIDA blendIDA onlyIDA totalIndiaIndonesiaIran, Islamic Rep.IraqIrelandIsraelItalyJamaicaJapanJordanKazakhstanKenyaKiribatiKorea, Dem. People’s Rep.Korea, Rep.KuwaitKyrgyz RepublicLao PDRLate-demographic dividendLatin America & Caribbean Latin America & Caribbean (excluding high income)Latin America & the Caribbean (IDA & IBRD countries)LatviaLeast developed countries: UN classificationLebanonLesothoLiberiaLibyaLiechtensteinLithuaniaLow & middle incomeLow incomeLower middle incomeLuxembourgMacao SAR, ChinaMacedonia, FYRMadagascarMalawiMaldivesMaliMaltaMarshall IslandsMauritaniaMauritiusMexicoMiddle East & North AfricaMiddle East & North Africa (excluding high income)Middle East & North Africa (IDA & IBRD countries)Middle incomeMoldovaMongoliaMontenegroMoroccoMozambiqueMyanmarNamibiaNauruNepalNetherlandsNew ZealandNicaraguaNigerNigeriaNorwayOECD membersOmanOther small statesPacific island small statesPakistanPalauPanamaPapua New GuineaParaguayPeruPhilippinesPolandPortugalPost-demographic dividendPre-demographic dividendQatarRomaniaRussian FederationRwandaSamoaSan MarinoSao Tome and PrincipeSaudi ArabiaSenegalSerbiaSeychellesSierra LeoneSlovak RepublicSloveniaSmall statesSolomon IslandsSouth AfricaSouth AsiaSouth Asia (IDA & IBRD)South SudanSpainSri LankaSt. Kitts and NevisSt. LuciaSt. Vincent and the GrenadinesSub-Saharan Africa Sub-Saharan Africa (excluding high income)Sub-Saharan Africa (IDA & IBRD countries)SudanSurinameSwazilandSwedenSwitzerlandSyrian Arab RepublicTajikistanTanzaniaThailandTimor-LesteTogoTongaTrinidad and TobagoTunisiaTurkeyTuvaluUgandaUkraineUnited Arab EmiratesUpper middle incomeUruguayUzbekistanVanuatuVenezuela, RBVietnamWest Bank and GazaWorldYemen, Rep.ZambiaZimbabwe línea de tiempo (timeline):
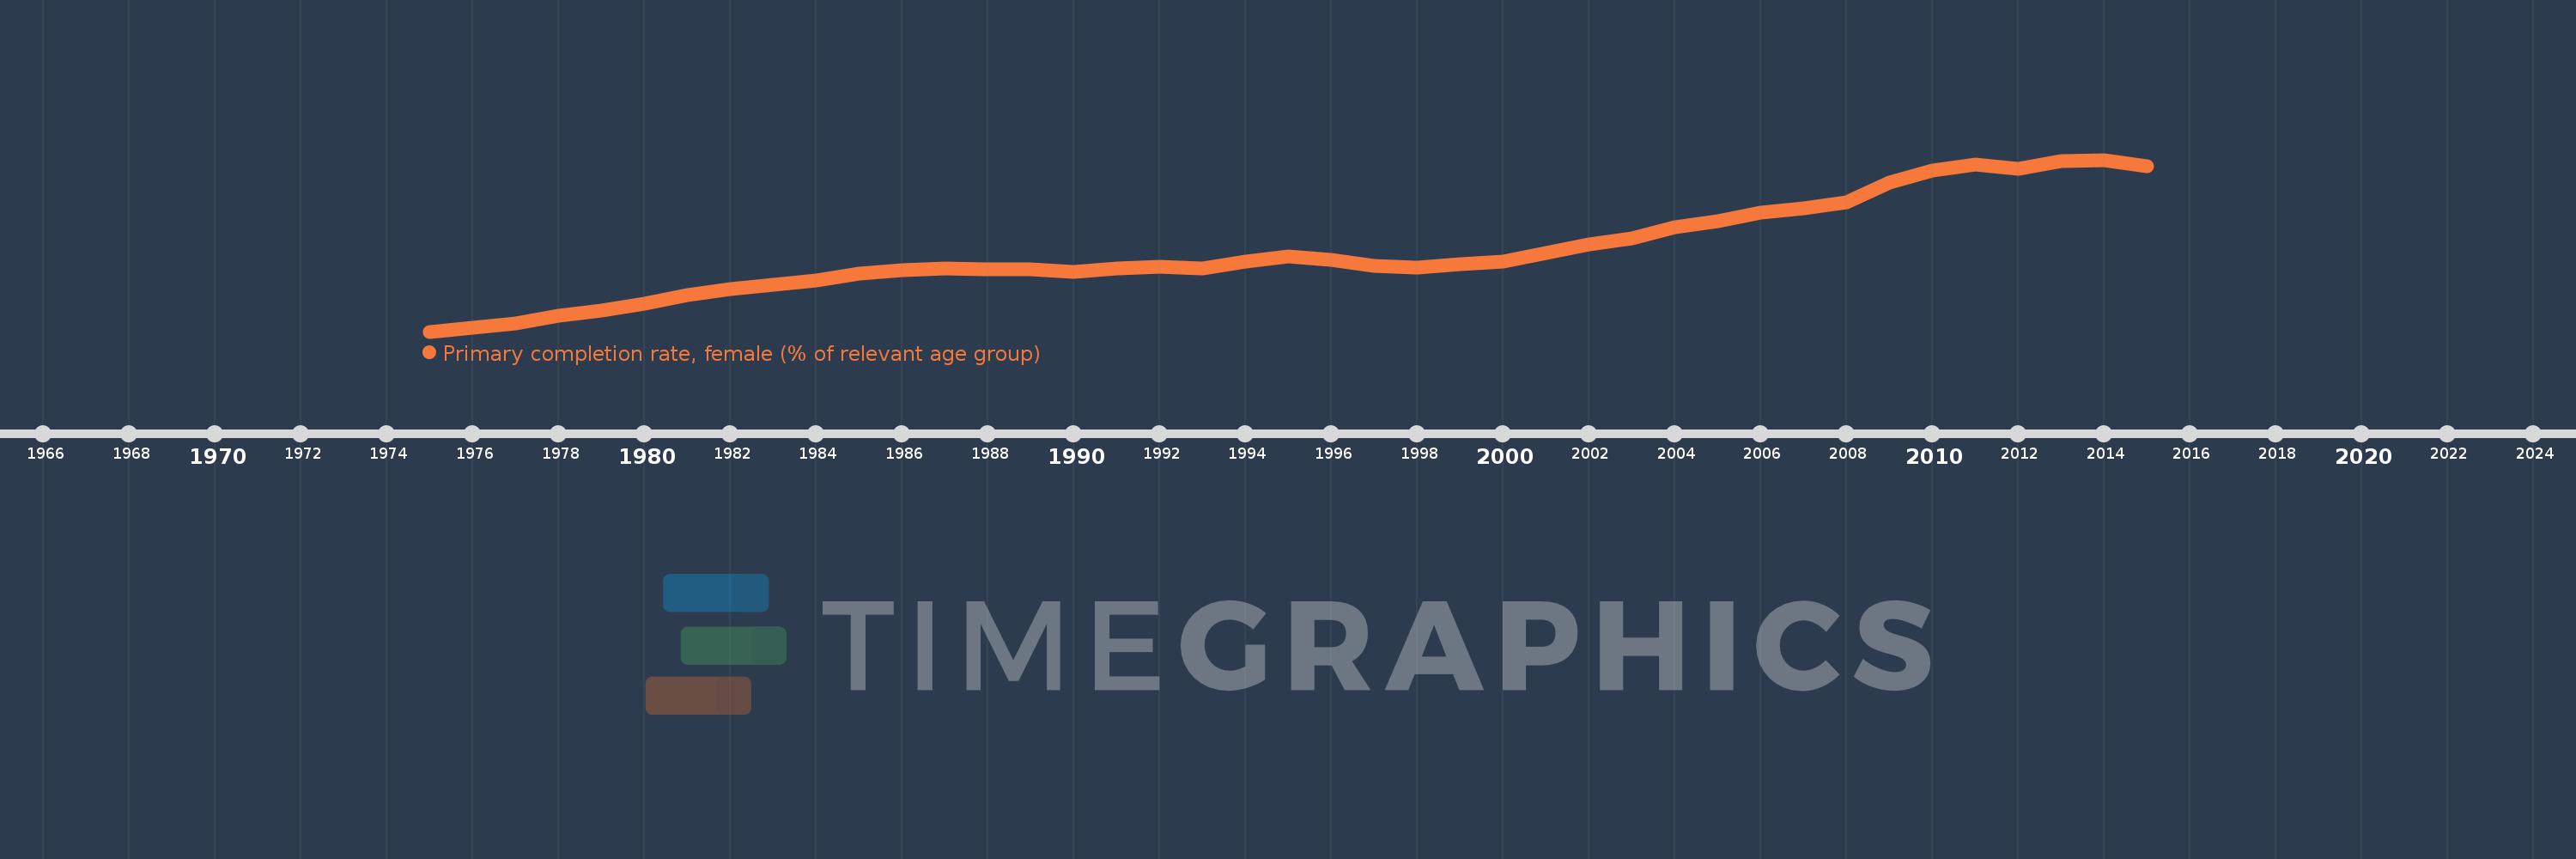
En esta escala de tiempo se presenta un gráfico de 1975 y 2015 de IDA & IBRD total. Los datos de 1974 están ausentes. El número de observaciones reales por fecha: 41.
Fuente (nombre):
Indicadores del desarrollo mundial
Fuente (organización):
United Nations Educational, Scientific, and Cultural Organization (UNESCO) Institute for Statistics.
Categorías:
Education, Gender
Se ha actualizado:
23 abr 2017 año
Los indicadores de los cambios de valor en los últimos años
Mínimo:
65.289
1 ene 1975 año
Máximo:
89.587
1 ene 2014 año
A la fecha de observación
Valor
Cambio absoluto
El cambio con respecto al valor anterior
1 ene 1975 año
65.289
+65.289
0.0%
1 ene 1976 año
65.833
+0.544
0.83%
1 ene 1977 año
66.477
+0.645
0.98%
1 ene 1978 año
67.505
+1.027
1.55%
1 ene 1979 año
68.279
+0.774
1.15%
1 ene 1980 año
69.216
+0.938
1.37%
1 ene 1981 año
70.4
+1.184
1.71%
1 ene 1982 año
71.305
+0.905
1.29%
1 ene 1983 año
71.928
+0.623
0.87%
1 ene 1984 año
72.538
+0.61
0.85%
1 ene 1985 año
73.544
+1.006
1.39%
1 ene 1986 año
74.017
+0.473
0.64%
1 ene 1987 año
74.202
+0.185
0.25%
1 ene 1988 año
74.099
-0.104
-0.14%
1 ene 1989 año
74.14
+0.041
0.06%
1 ene 1990 año
73.768
-0.372
-0.5%
1 ene 1991 año
74.179
+0.411
0.56%
1 ene 1992 año
74.508
+0.329
0.44%
1 ene 1993 año
74.213
-0.296
-0.4%
1 ene 1994 año
75.197
+0.984
1.33%
1 ene 1995 año
75.913
+0.716
0.95%
1 ene 1996 año
75.46
-0.453
-0.6%
1 ene 1997 año
74.577
-0.883
-1.17%
1 ene 1998 año
74.393
-0.184
-0.25%
1 ene 1999 año
74.801
+0.408
0.55%
1 ene 2000 año
75.226
+0.425
0.57%
1 ene 2001 año
76.43
+1.205
1.6%
1 ene 2002 año
77.636
+1.206
1.58%
1 ene 2003 año
78.446
+0.809
1.04%
1 ene 2004 año
80.047
+1.602
2.04%
1 ene 2005 año
80.93
+0.883
1.1%
1 ene 2006 año
82.071
+1.141
1.41%
1 ene 2007 año
82.764
+0.693
0.84%
1 ene 2008 año
83.59
+0.826
1.0%
1 ene 2009 año
86.396
+2.806
3.36%
1 ene 2010 año
88.124
+1.728
2.0%
1 ene 2011 año
88.903
+0.78
0.88%
1 ene 2012 año
88.349
-0.554
-0.62%
1 ene 2013 año
89.443
+1.094
1.24%
1 ene 2014 año
89.587
+0.144
0.16%
1 ene 2015 año
88.619
-0.968
-1.08%
Ranking de los países por los datos estadísticos actuales


Comentarios: