29
/es/
es
AIzaSyAYiBZKx7MnpbEhh9jyipgxe19OcubqV5w
April 1, 2024
42914
Latin America & Caribbean (excluding high income)
LAC
false
2
1
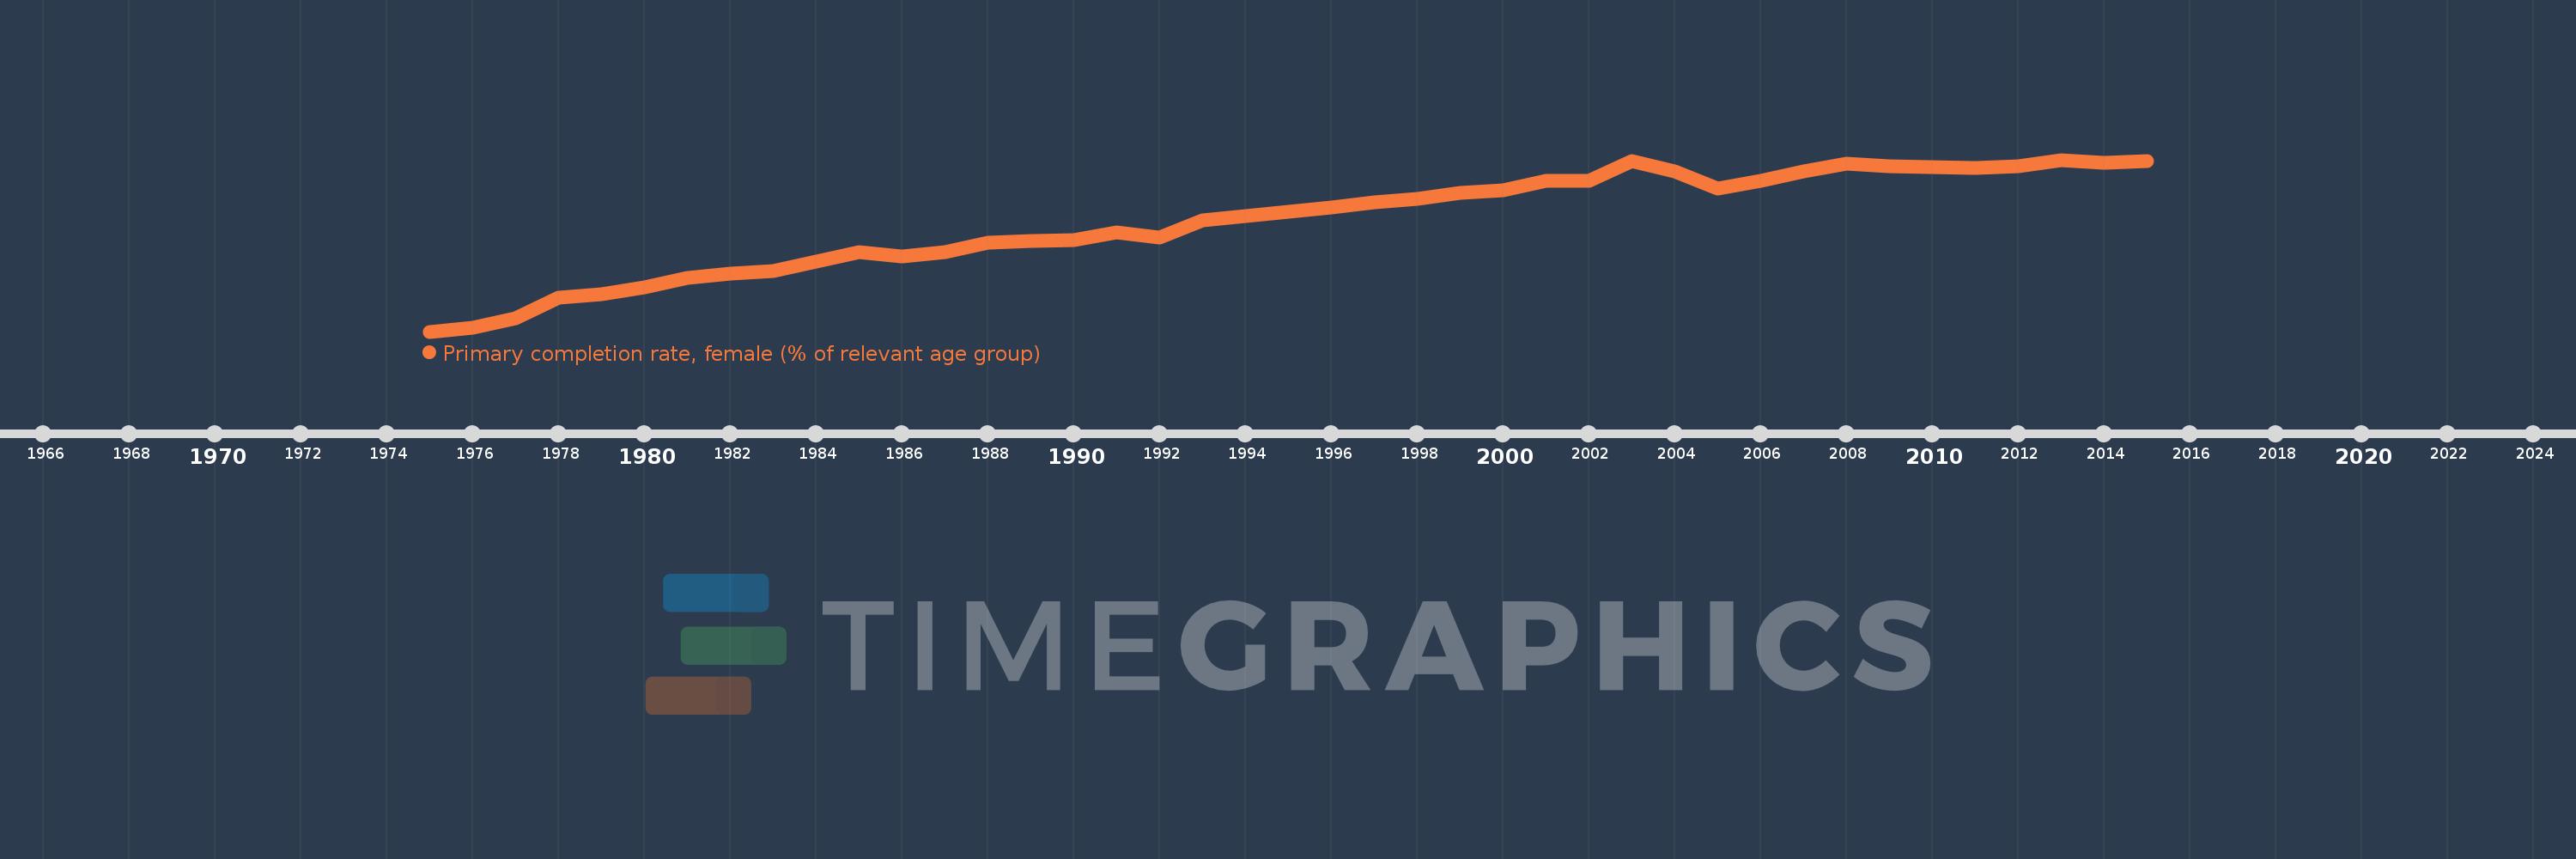
Primary completion rate, female (% of relevant age group)
2015,2014,2013,2012,2011,2010,2009,2008,2007,2006,2005,2004,2003,2002,2001,2000,1999,1998,1997,1996,1995,1994,1993,1992,1991,1990,1989,1988,1987,1986,1985,1984,1983,1982,1981,1980,1979,1978,1977,1976,1975
Estas estadísticas en otros países:
AfghanistanAlbaniaAlgeriaAngolaAntigua and BarbudaArab WorldArgentinaArmeniaArubaAustriaAzerbaijanBahamas, TheBahrainBangladeshBarbadosBelarusBelgiumBelizeBeninBermudaBhutanBoliviaBosnia and HerzegovinaBotswanaBrunei DarussalamBulgariaBurkina FasoBurundiCabo VerdeCambodiaCameroonCanadaCaribbean small statesCentral African RepublicCentral Europe and the BalticsChadChileChinaColombiaComorosCongo, Dem. Rep.Congo, Rep.Costa RicaCote d'IvoireCroatiaCubaCyprusCzech RepublicDenmarkDjiboutiDominicaDominican RepublicEarly-demographic dividendEast Asia & PacificEast Asia & Pacific (excluding high income)East Asia & Pacific (IDA & IBRD countries)EcuadorEgypt, Arab Rep.El SalvadorEquatorial GuineaEritreaEstoniaEthiopiaEuro areaEurope & Central AsiaEurope & Central Asia (excluding high income)Europe & Central Asia (IDA & IBRD countries)European UnionFijiFinlandFragile and conflict affected situationsFranceGabonGambia, TheGeorgiaGermanyGhanaGreeceGrenadaGuatemalaGuineaGuinea-BissauGuyanaHaitiHeavily indebted poor countries (HIPC)High incomeHondurasHong Kong SAR, ChinaHungaryIBRD onlyIcelandIDA & IBRD totalIDA blendIDA onlyIDA totalIndiaIndonesiaIran, Islamic Rep.IraqIrelandIsraelItalyJamaicaJapanJordanKazakhstanKenyaKiribatiKorea, Dem. People’s Rep.Korea, Rep.KuwaitKyrgyz RepublicLao PDRLate-demographic dividendLatin America & Caribbean Latin America & Caribbean (excluding high income)Latin America & the Caribbean (IDA & IBRD countries)LatviaLeast developed countries: UN classificationLebanonLesothoLiberiaLibyaLiechtensteinLithuaniaLow & middle incomeLow incomeLower middle incomeLuxembourgMacao SAR, ChinaMacedonia, FYRMadagascarMalawiMaldivesMaliMaltaMarshall IslandsMauritaniaMauritiusMexicoMiddle East & North AfricaMiddle East & North Africa (excluding high income)Middle East & North Africa (IDA & IBRD countries)Middle incomeMoldovaMongoliaMontenegroMoroccoMozambiqueMyanmarNamibiaNauruNepalNetherlandsNew ZealandNicaraguaNigerNigeriaNorwayOECD membersOmanOther small statesPacific island small statesPakistanPalauPanamaPapua New GuineaParaguayPeruPhilippinesPolandPortugalPost-demographic dividendPre-demographic dividendQatarRomaniaRussian FederationRwandaSamoaSan MarinoSao Tome and PrincipeSaudi ArabiaSenegalSerbiaSeychellesSierra LeoneSlovak RepublicSloveniaSmall statesSolomon IslandsSouth AfricaSouth AsiaSouth Asia (IDA & IBRD)South SudanSpainSri LankaSt. Kitts and NevisSt. LuciaSt. Vincent and the GrenadinesSub-Saharan Africa Sub-Saharan Africa (excluding high income)Sub-Saharan Africa (IDA & IBRD countries)SudanSurinameSwazilandSwedenSwitzerlandSyrian Arab RepublicTajikistanTanzaniaThailandTimor-LesteTogoTongaTrinidad and TobagoTunisiaTurkeyTuvaluUgandaUkraineUnited Arab EmiratesUpper middle incomeUruguayUzbekistanVanuatuVenezuela, RBVietnamWest Bank and GazaWorldYemen, Rep.ZambiaZimbabwe línea de tiempo (timeline):
En esta escala de tiempo se presenta un gráfico de 1975 y 2015 de Latin America & Caribbean (excluding high income). Los datos de 1974 están ausentes. El número de observaciones reales por fecha: 41.
Fuente (nombre):
Indicadores del desarrollo mundial
Fuente (organización):
United Nations Educational, Scientific, and Cultural Organization (UNESCO) Institute for Statistics.
Categorías:
Education, Gender
Se ha actualizado:
23 abr 2017 año
Los indicadores de los cambios de valor en los últimos años
Mínimo:
81.674
1 ene 1975 año
Máximo:
100.514
1 ene 2013 año
A la fecha de observación
Valor
Cambio absoluto
El cambio con respecto al valor anterior
1 ene 1975 año
81.674
+81.674
0.0%
1 ene 1976 año
82.095
+0.421
0.52%
1 ene 1977 año
83.149
+1.055
1.28%
1 ene 1978 año
85.418
+2.269
2.73%
1 ene 1979 año
85.8
+0.381
0.45%
1 ene 1980 año
86.563
+0.764
0.89%
1 ene 1981 año
87.578
+1.015
1.17%
1 ene 1982 año
87.99
+0.412
0.47%
1 ene 1983 año
88.287
+0.297
0.34%
1 ene 1984 año
89.318
+1.031
1.17%
1 ene 1985 año
90.365
+1.047
1.17%
1 ene 1986 año
89.962
-0.402
-0.45%
1 ene 1987 año
90.395
+0.433
0.48%
1 ene 1988 año
91.401
+1.006
1.11%
1 ene 1989 año
91.634
+0.233
0.26%
1 ene 1990 año
91.664
+0.03
0.03%
1 ene 1991 año
92.59
+0.926
1.01%
1 ene 1992 año
91.993
-0.597
-0.64%
1 ene 1993 año
93.904
+1.911
2.08%
1 ene 1994 año
94.364
+0.46
0.49%
1 ene 1995 año
94.827
+0.463
0.49%
1 ene 1996 año
95.321
+0.494
0.52%
1 ene 1997 año
95.878
+0.557
0.58%
1 ene 1998 año
96.217
+0.339
0.35%
1 ene 1999 año
96.852
+0.634
0.66%
1 ene 2000 año
97.201
+0.35
0.36%
1 ene 2001 año
98.207
+1.006
1.03%
1 ene 2002 año
98.24
+0.033
0.03%
1 ene 2003 año
100.391
+2.15
2.19%
1 ene 2004 año
99.281
-1.109
-1.1%
1 ene 2005 año
97.312
-1.97
-1.98%
1 ene 2006 año
98.198
+0.887
0.91%
1 ene 2007 año
99.225
+1.026
1.05%
1 ene 2008 año
100.116
+0.891
0.9%
1 ene 2009 año
99.8
-0.317
-0.32%
1 ene 2010 año
99.711
-0.089
-0.09%
1 ene 2011 año
99.664
-0.047
-0.05%
1 ene 2012 año
99.782
+0.118
0.12%
1 ene 2013 año
100.514
+0.732
0.73%
1 ene 2014 año
100.206
-0.309
-0.31%
1 ene 2015 año
100.404
+0.198
0.2%
Ranking de los países por los datos estadísticos actuales


Comentarios: