29
/es/
es
AIzaSyAYiBZKx7MnpbEhh9jyipgxe19OcubqV5w
April 1, 2024
126821
El Salvador
SLV
true
2
1
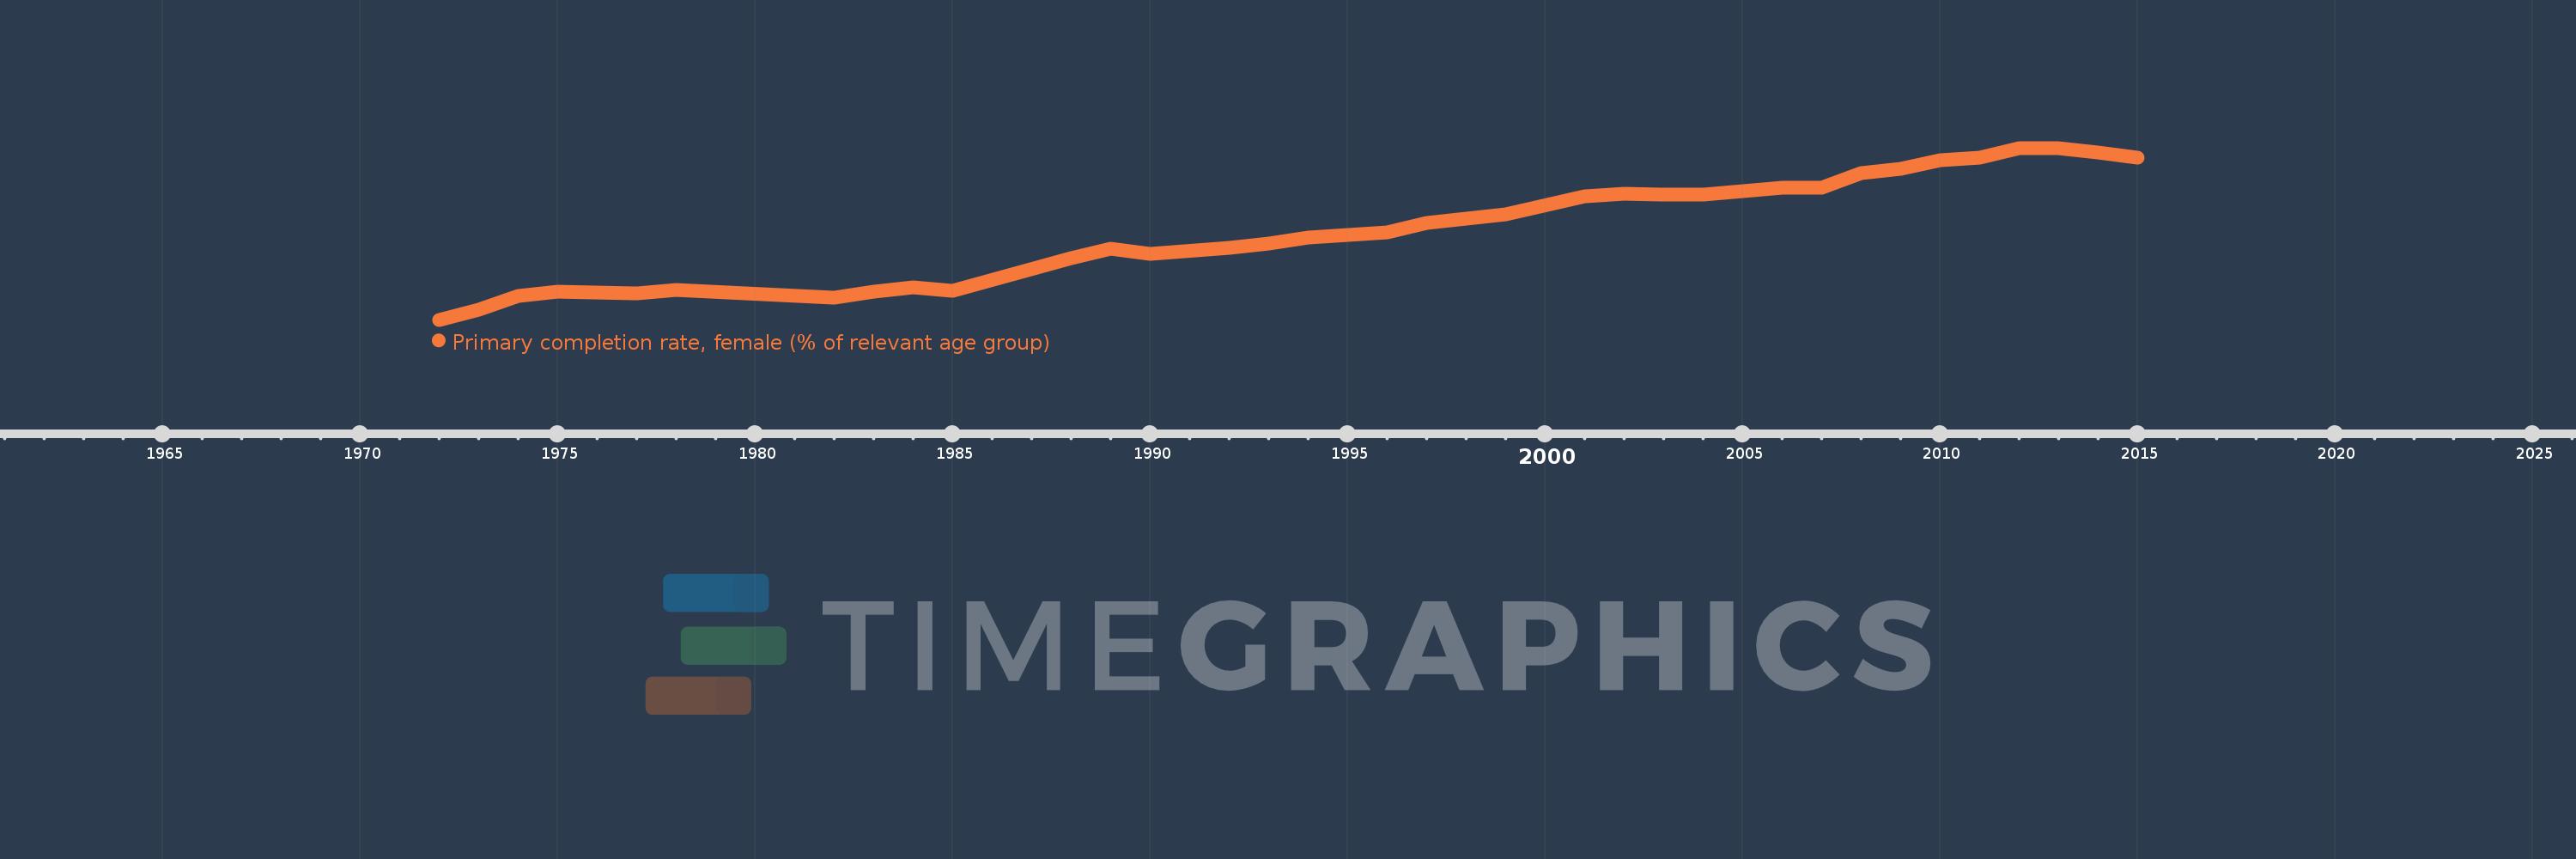
Primary completion rate, female (% of relevant age group)
2015,2014,2013,2012,2011,2010,2009,2008,2007,2006,2004,2003,2002,2001,1999,1997,1996,1994,1993,1992,1990,1989,1988,1985,1984,1983,1982,1978,1977,1975,1974,1973,1972
Estas estadísticas en otros países:
AfghanistanAlbaniaAlgeriaAngolaAntigua and BarbudaArab WorldArgentinaArmeniaArubaAustriaAzerbaijanBahamas, TheBahrainBangladeshBarbadosBelarusBelgiumBelizeBeninBermudaBhutanBoliviaBosnia and HerzegovinaBotswanaBrunei DarussalamBulgariaBurkina FasoBurundiCabo VerdeCambodiaCameroonCanadaCaribbean small statesCentral African RepublicCentral Europe and the BalticsChadChileChinaColombiaComorosCongo, Dem. Rep.Congo, Rep.Costa RicaCote d'IvoireCroatiaCubaCyprusCzech RepublicDenmarkDjiboutiDominicaDominican RepublicEarly-demographic dividendEast Asia & PacificEast Asia & Pacific (excluding high income)East Asia & Pacific (IDA & IBRD countries)EcuadorEgypt, Arab Rep.El SalvadorEquatorial GuineaEritreaEstoniaEthiopiaEuro areaEurope & Central AsiaEurope & Central Asia (excluding high income)Europe & Central Asia (IDA & IBRD countries)European UnionFijiFinlandFragile and conflict affected situationsFranceGabonGambia, TheGeorgiaGermanyGhanaGreeceGrenadaGuatemalaGuineaGuinea-BissauGuyanaHaitiHeavily indebted poor countries (HIPC)High incomeHondurasHong Kong SAR, ChinaHungaryIBRD onlyIcelandIDA & IBRD totalIDA blendIDA onlyIDA totalIndiaIndonesiaIran, Islamic Rep.IraqIrelandIsraelItalyJamaicaJapanJordanKazakhstanKenyaKiribatiKorea, Dem. People’s Rep.Korea, Rep.KuwaitKyrgyz RepublicLao PDRLate-demographic dividendLatin America & Caribbean Latin America & Caribbean (excluding high income)Latin America & the Caribbean (IDA & IBRD countries)LatviaLeast developed countries: UN classificationLebanonLesothoLiberiaLibyaLiechtensteinLithuaniaLow & middle incomeLow incomeLower middle incomeLuxembourgMacao SAR, ChinaMacedonia, FYRMadagascarMalawiMaldivesMaliMaltaMarshall IslandsMauritaniaMauritiusMexicoMiddle East & North AfricaMiddle East & North Africa (excluding high income)Middle East & North Africa (IDA & IBRD countries)Middle incomeMoldovaMongoliaMontenegroMoroccoMozambiqueMyanmarNamibiaNauruNepalNetherlandsNew ZealandNicaraguaNigerNigeriaNorwayOECD membersOmanOther small statesPacific island small statesPakistanPalauPanamaPapua New GuineaParaguayPeruPhilippinesPolandPortugalPost-demographic dividendPre-demographic dividendQatarRomaniaRussian FederationRwandaSamoaSan MarinoSao Tome and PrincipeSaudi ArabiaSenegalSerbiaSeychellesSierra LeoneSlovak RepublicSloveniaSmall statesSolomon IslandsSouth AfricaSouth AsiaSouth Asia (IDA & IBRD)South SudanSpainSri LankaSt. Kitts and NevisSt. LuciaSt. Vincent and the GrenadinesSub-Saharan Africa Sub-Saharan Africa (excluding high income)Sub-Saharan Africa (IDA & IBRD countries)SudanSurinameSwazilandSwedenSwitzerlandSyrian Arab RepublicTajikistanTanzaniaThailandTimor-LesteTogoTongaTrinidad and TobagoTunisiaTurkeyTuvaluUgandaUkraineUnited Arab EmiratesUpper middle incomeUruguayUzbekistanVanuatuVenezuela, RBVietnamWest Bank and GazaWorldYemen, Rep.ZambiaZimbabwe línea de tiempo (timeline):
En esta escala de tiempo se presenta un gráfico de 1972 y 2015 de El Salvador. Los datos de 1971 están ausentes. El número de observaciones reales por fecha: 33.
Fuente (nombre):
Indicadores del desarrollo mundial
Fuente (organización):
United Nations Educational, Scientific, and Cultural Organization (UNESCO) Institute for Statistics.
Categorías:
Education, Gender
Se ha actualizado:
23 abr 2017 año
Los indicadores de los cambios de valor en los últimos años
Mínimo:
37.68
1 ene 1972 año
Máximo:
109.06
1 ene 2012 año
A la fecha de observación
Valor
Cambio absoluto
El cambio con respecto al valor anterior
1 ene 1972 año
37.68
+37.68
0.0%
1 ene 1973 año
42.026
+4.346
11.53%
1 ene 1974 año
47.422
+5.396
12.84%
1 ene 1975 año
49.383
+1.961
4.14%
1 ene 1977 año
48.805
-0.578
-1.17%
1 ene 1978 año
50.218
+1.413
2.9%
1 ene 1982 año
46.771
-3.447
-6.86%
1 ene 1983 año
49.482
+2.711
5.8%
1 ene 1984 año
51.03
+1.548
3.13%
1 ene 1985 año
49.695
-1.335
-2.62%
1 ene 1988 año
63.148
+13.454
27.07%
1 ene 1989 año
67.106
+3.958
6.27%
1 ene 1990 año
65.011
-2.096
-3.12%
1 ene 1992 año
67.724
+2.714
4.17%
1 ene 1993 año
69.325
+1.601
2.36%
1 ene 1994 año
71.866
+2.541
3.67%
1 ene 1996 año
73.98
+2.114
2.94%
1 ene 1997 año
77.757
+3.776
5.1%
1 ene 1999 año
81.471
+3.715
4.78%
1 ene 2001 año
89.02
+7.549
9.27%
1 ene 2002 año
89.994
+0.974
1.09%
1 ene 2003 año
89.59
-0.404
-0.45%
1 ene 2004 año
89.621
+0.031
0.03%
1 ene 2006 año
92.509
+2.888
3.22%
1 ene 2007 año
92.618
+0.109
0.12%
1 ene 2008 año
98.734
+6.116
6.6%
1 ene 2009 año
100.458
+1.724
1.75%
1 ene 2010 año
103.887
+3.429
3.41%
1 ene 2011 año
104.956
+1.068
1.03%
1 ene 2012 año
109.06
+4.104
3.91%
1 ene 2013 año
108.865
-0.195
-0.18%
1 ene 2014 año
107.047
-1.818
-1.67%
1 ene 2015 año
105.016
-2.031
-1.9%
Ranking de los países por los datos estadísticos actuales


Comentarios: