29
/es/
es
AIzaSyAYiBZKx7MnpbEhh9jyipgxe19OcubqV5w
April 1, 2024
164175
Japan
JPN
true
2
1
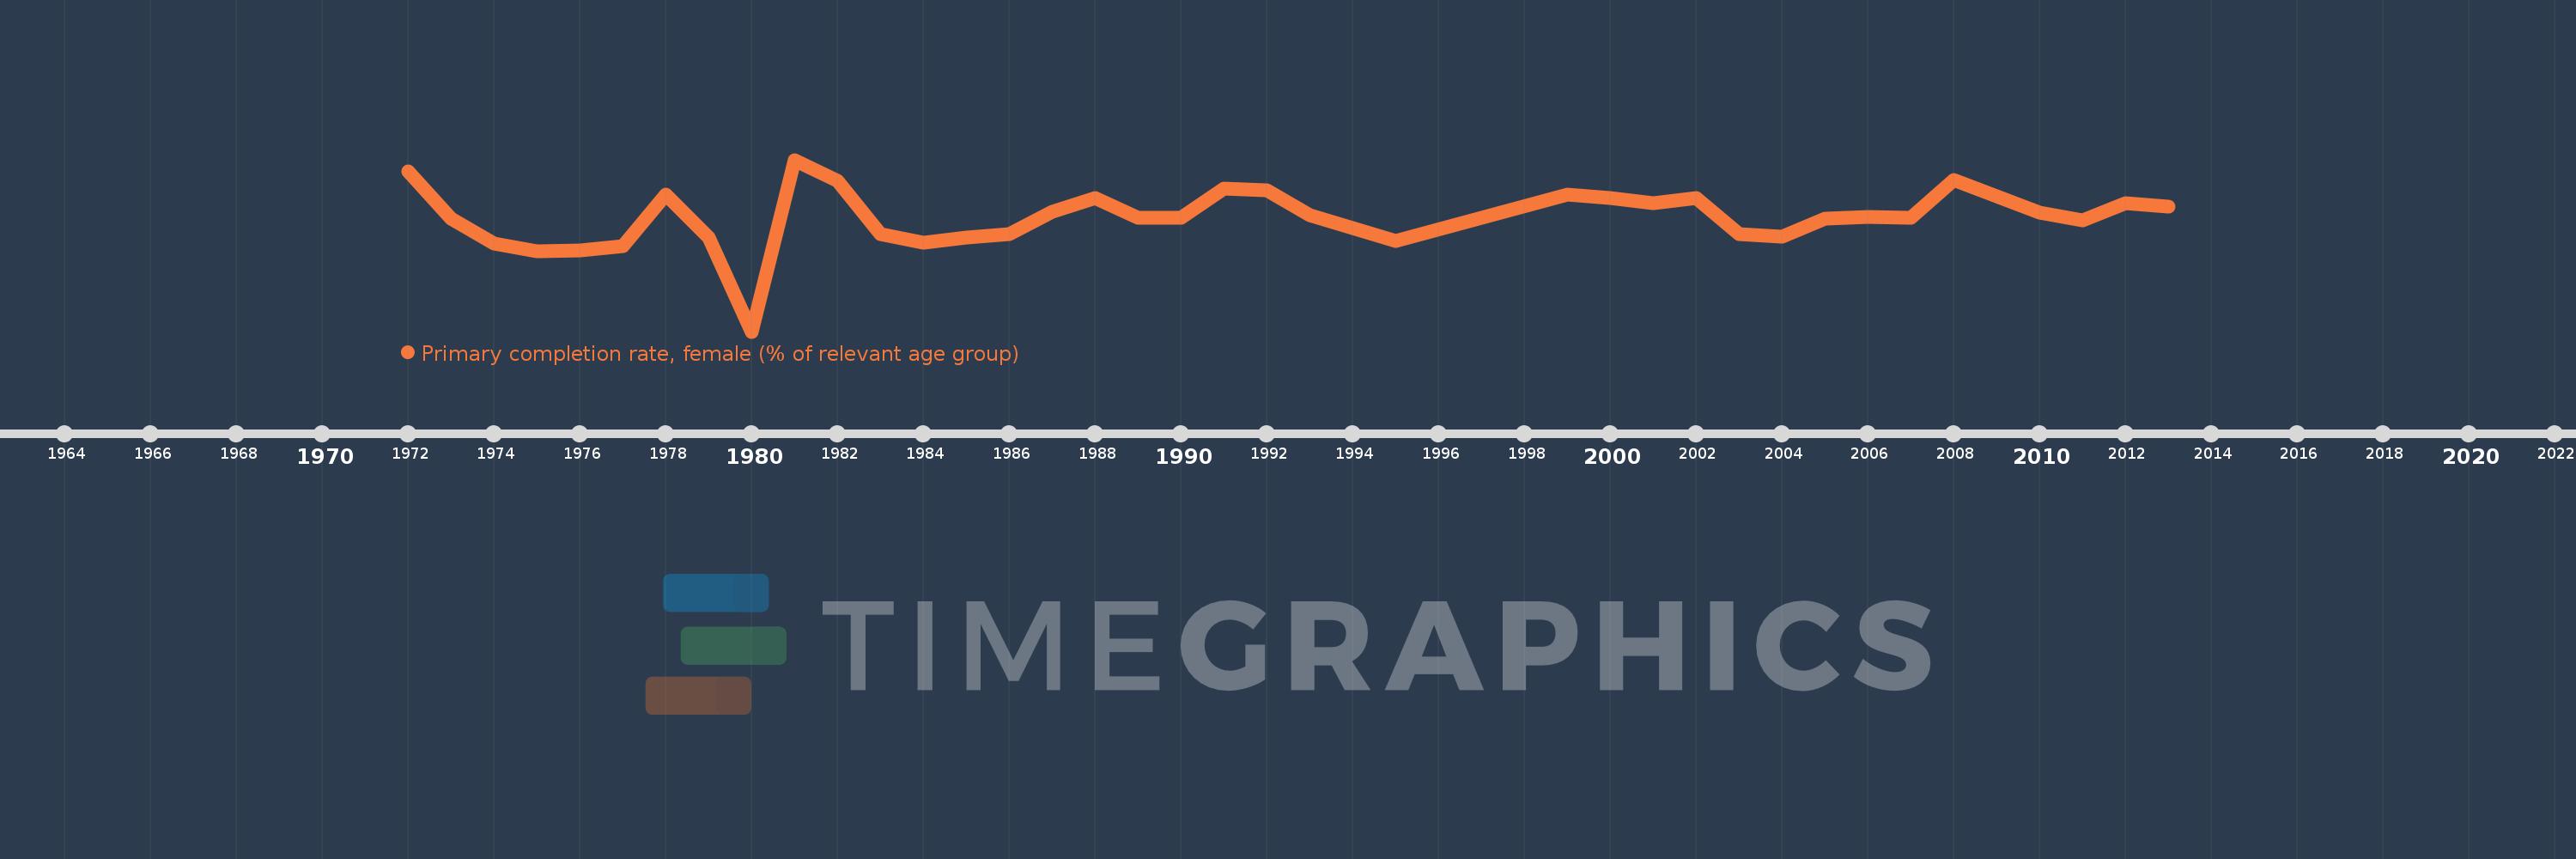
Primary completion rate, female (% of relevant age group)
2013,2012,2011,2010,2008,2007,2006,2005,2004,2003,2002,2001,2000,1999,1995,1993,1992,1991,1990,1989,1988,1987,1986,1985,1984,1983,1982,1981,1980,1979,1978,1977,1976,1975,1974,1973,1972
Estas estadísticas en otros países:
AfghanistanAlbaniaAlgeriaAngolaAntigua and BarbudaArab WorldArgentinaArmeniaArubaAustriaAzerbaijanBahamas, TheBahrainBangladeshBarbadosBelarusBelgiumBelizeBeninBermudaBhutanBoliviaBosnia and HerzegovinaBotswanaBrunei DarussalamBulgariaBurkina FasoBurundiCabo VerdeCambodiaCameroonCanadaCaribbean small statesCentral African RepublicCentral Europe and the BalticsChadChileChinaColombiaComorosCongo, Dem. Rep.Congo, Rep.Costa RicaCote d'IvoireCroatiaCubaCyprusCzech RepublicDenmarkDjiboutiDominicaDominican RepublicEarly-demographic dividendEast Asia & PacificEast Asia & Pacific (excluding high income)East Asia & Pacific (IDA & IBRD countries)EcuadorEgypt, Arab Rep.El SalvadorEquatorial GuineaEritreaEstoniaEthiopiaEuro areaEurope & Central AsiaEurope & Central Asia (excluding high income)Europe & Central Asia (IDA & IBRD countries)European UnionFijiFinlandFragile and conflict affected situationsFranceGabonGambia, TheGeorgiaGermanyGhanaGreeceGrenadaGuatemalaGuineaGuinea-BissauGuyanaHaitiHeavily indebted poor countries (HIPC)High incomeHondurasHong Kong SAR, ChinaHungaryIBRD onlyIcelandIDA & IBRD totalIDA blendIDA onlyIDA totalIndiaIndonesiaIran, Islamic Rep.IraqIrelandIsraelItalyJamaicaJapanJordanKazakhstanKenyaKiribatiKorea, Dem. People’s Rep.Korea, Rep.KuwaitKyrgyz RepublicLao PDRLate-demographic dividendLatin America & Caribbean Latin America & Caribbean (excluding high income)Latin America & the Caribbean (IDA & IBRD countries)LatviaLeast developed countries: UN classificationLebanonLesothoLiberiaLibyaLiechtensteinLithuaniaLow & middle incomeLow incomeLower middle incomeLuxembourgMacao SAR, ChinaMacedonia, FYRMadagascarMalawiMaldivesMaliMaltaMarshall IslandsMauritaniaMauritiusMexicoMiddle East & North AfricaMiddle East & North Africa (excluding high income)Middle East & North Africa (IDA & IBRD countries)Middle incomeMoldovaMongoliaMontenegroMoroccoMozambiqueMyanmarNamibiaNauruNepalNetherlandsNew ZealandNicaraguaNigerNigeriaNorwayOECD membersOmanOther small statesPacific island small statesPakistanPalauPanamaPapua New GuineaParaguayPeruPhilippinesPolandPortugalPost-demographic dividendPre-demographic dividendQatarRomaniaRussian FederationRwandaSamoaSan MarinoSao Tome and PrincipeSaudi ArabiaSenegalSerbiaSeychellesSierra LeoneSlovak RepublicSloveniaSmall statesSolomon IslandsSouth AfricaSouth AsiaSouth Asia (IDA & IBRD)South SudanSpainSri LankaSt. Kitts and NevisSt. LuciaSt. Vincent and the GrenadinesSub-Saharan Africa Sub-Saharan Africa (excluding high income)Sub-Saharan Africa (IDA & IBRD countries)SudanSurinameSwazilandSwedenSwitzerlandSyrian Arab RepublicTajikistanTanzaniaThailandTimor-LesteTogoTongaTrinidad and TobagoTunisiaTurkeyTuvaluUgandaUkraineUnited Arab EmiratesUpper middle incomeUruguayUzbekistanVanuatuVenezuela, RBVietnamWest Bank and GazaWorldYemen, Rep.ZambiaZimbabwe línea de tiempo (timeline):
En esta escala de tiempo se presenta un gráfico de 1972 y 2013 de Japan. Los datos de 1971 están ausentes. El número de observaciones reales por fecha: 37.
Fuente (nombre):
Indicadores del desarrollo mundial
Fuente (organización):
United Nations Educational, Scientific, and Cultural Organization (UNESCO) Institute for Statistics.
Categorías:
Education, Gender
Se ha actualizado:
23 abr 2017 año
Los indicadores de los cambios de valor en los últimos años
Mínimo:
90.676
1 ene 1980 año
Máximo:
106.152
1 ene 1981 año
A la fecha de observación
Valor
Cambio absoluto
El cambio con respecto al valor anterior
1 ene 1972 año
105.126
+105.126
0.0%
1 ene 1973 año
100.832
-4.294
-4.08%
1 ene 1974 año
98.609
-2.223
-2.2%
1 ene 1975 año
97.878
-0.731
-0.74%
1 ene 1976 año
97.979
+0.101
0.1%
1 ene 1977 año
98.341
+0.362
0.37%
1 ene 1978 año
103.0
+4.659
4.74%
1 ene 1979 año
99.125
-3.875
-3.76%
1 ene 1980 año
90.676
-8.449
-8.52%
1 ene 1981 año
106.152
+15.476
17.07%
1 ene 1982 año
104.232
-1.92
-1.81%
1 ene 1983 año
99.461
-4.77
-4.58%
1 ene 1984 año
98.709
-0.753
-0.76%
1 ene 1985 año
99.163
+0.454
0.46%
1 ene 1986 año
99.477
+0.314
0.32%
1 ene 1987 año
101.483
+2.005
2.02%
1 ene 1988 año
102.723
+1.24
1.22%
1 ene 1989 año
100.897
-1.825
-1.78%
1 ene 1990 año
100.945
+0.047
0.05%
1 ene 1991 año
103.524
+2.579
2.56%
1 ene 1992 año
103.391
-0.133
-0.13%
1 ene 1993 año
101.188
-2.203
-2.13%
1 ene 1995 año
98.822
-2.366
-2.34%
1 ene 1999 año
103.008
+4.186
4.24%
1 ene 2000 año
102.697
-0.311
-0.3%
1 ene 2001 año
102.273
-0.424
-0.41%
1 ene 2002 año
102.67
+0.396
0.39%
1 ene 2003 año
99.424
-3.245
-3.16%
1 ene 2004 año
99.198
-0.227
-0.23%
1 ene 2005 año
100.82
+1.622
1.64%
1 ene 2006 año
101.019
+0.199
0.2%
1 ene 2007 año
100.919
-0.101
-0.1%
1 ene 2008 año
104.322
+3.404
3.37%
1 ene 2010 año
101.427
-2.895
-2.77%
1 ene 2011 año
100.731
-0.696
-0.69%
1 ene 2012 año
102.214
+1.483
1.47%
1 ene 2013 año
101.955
-0.259
-0.25%
Ranking de los países por los datos estadísticos actuales


Comentarios: