29
/es/
es
AIzaSyAYiBZKx7MnpbEhh9jyipgxe19OcubqV5w
April 1, 2024
43810
Latin America & the Caribbean (IDA & IBRD countries)
TLA
false
2
1
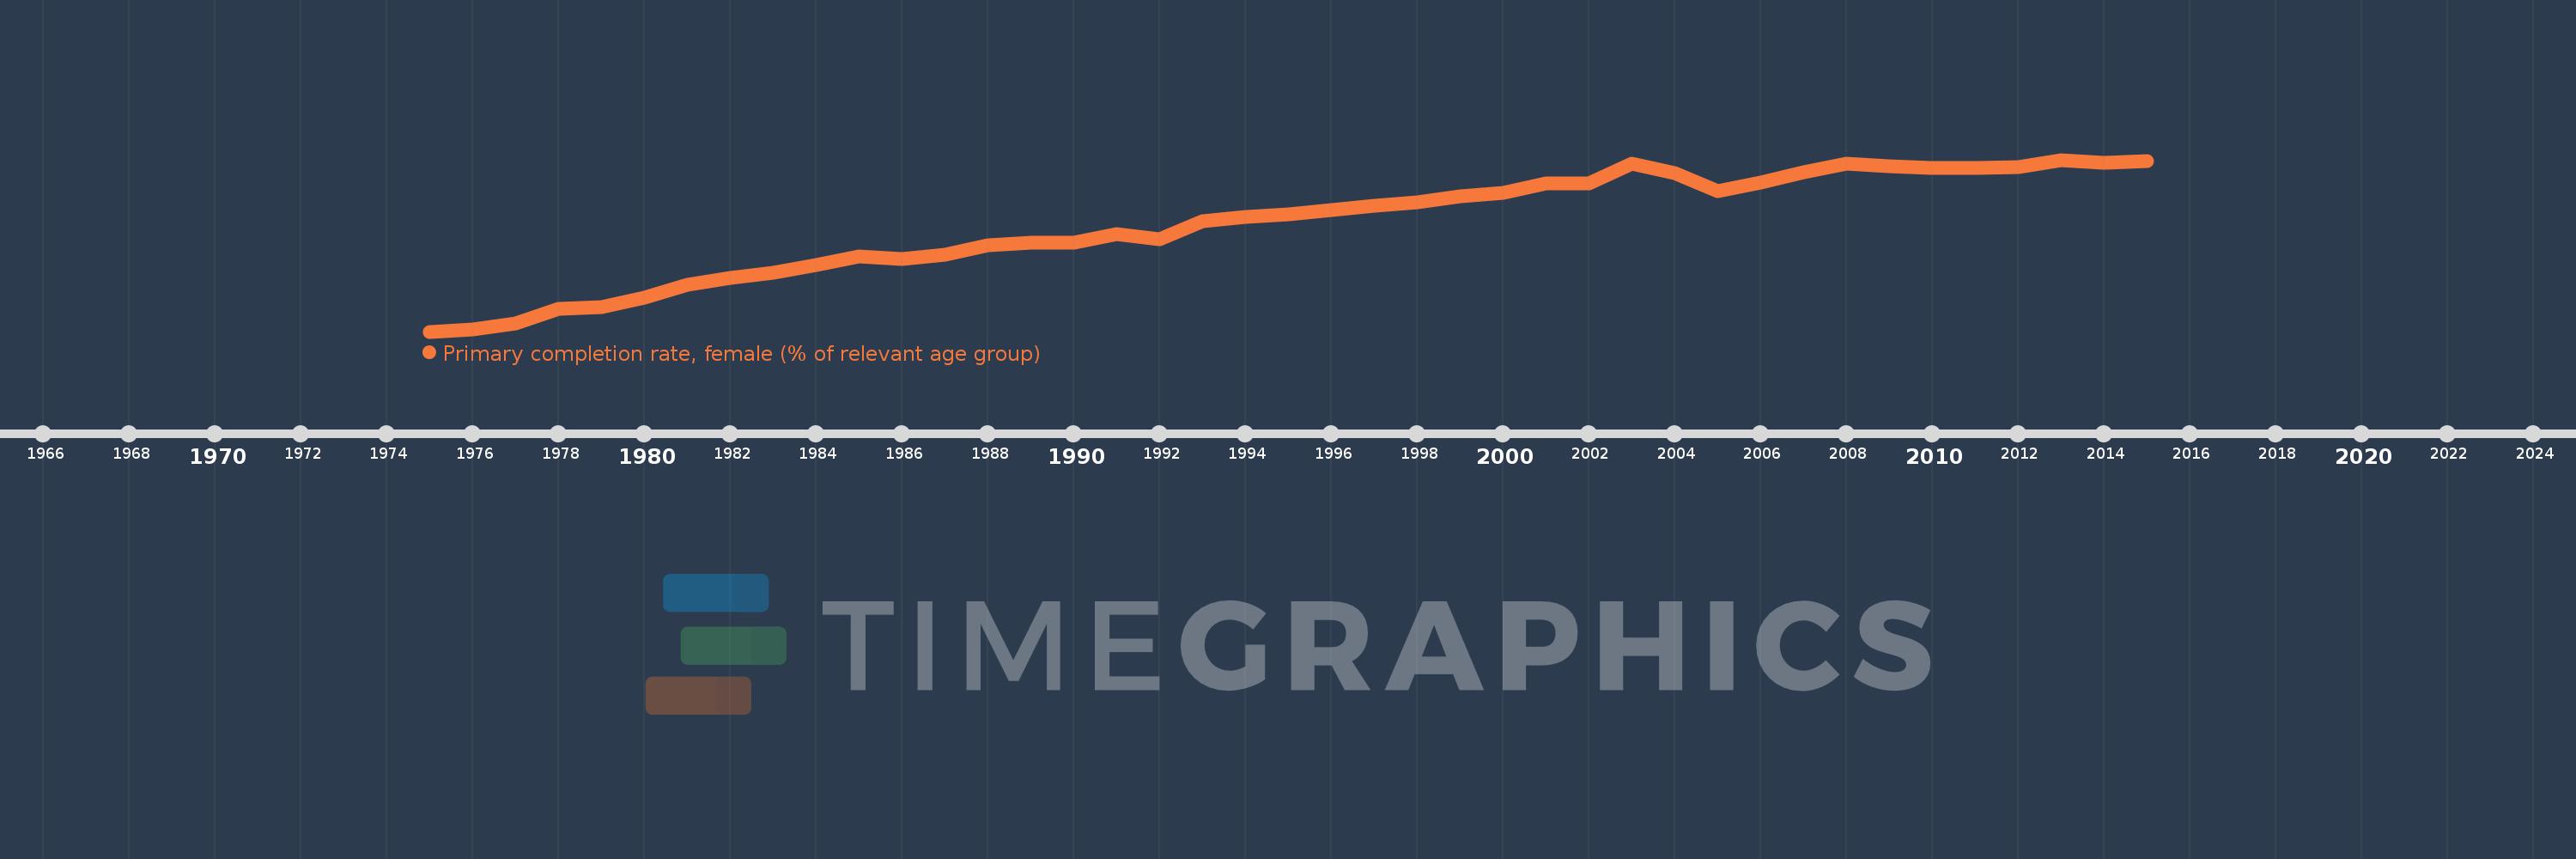
Primary completion rate, female (% of relevant age group)
2015,2014,2013,2012,2011,2010,2009,2008,2007,2006,2005,2004,2003,2002,2001,2000,1999,1998,1997,1996,1995,1994,1993,1992,1991,1990,1989,1988,1987,1986,1985,1984,1983,1982,1981,1980,1979,1978,1977,1976,1975
Estas estadísticas en otros países:
AfghanistanAlbaniaAlgeriaAngolaAntigua and BarbudaArab WorldArgentinaArmeniaArubaAustriaAzerbaijanBahamas, TheBahrainBangladeshBarbadosBelarusBelgiumBelizeBeninBermudaBhutanBoliviaBosnia and HerzegovinaBotswanaBrunei DarussalamBulgariaBurkina FasoBurundiCabo VerdeCambodiaCameroonCanadaCaribbean small statesCentral African RepublicCentral Europe and the BalticsChadChileChinaColombiaComorosCongo, Dem. Rep.Congo, Rep.Costa RicaCote d'IvoireCroatiaCubaCyprusCzech RepublicDenmarkDjiboutiDominicaDominican RepublicEarly-demographic dividendEast Asia & PacificEast Asia & Pacific (excluding high income)East Asia & Pacific (IDA & IBRD countries)EcuadorEgypt, Arab Rep.El SalvadorEquatorial GuineaEritreaEstoniaEthiopiaEuro areaEurope & Central AsiaEurope & Central Asia (excluding high income)Europe & Central Asia (IDA & IBRD countries)European UnionFijiFinlandFragile and conflict affected situationsFranceGabonGambia, TheGeorgiaGermanyGhanaGreeceGrenadaGuatemalaGuineaGuinea-BissauGuyanaHaitiHeavily indebted poor countries (HIPC)High incomeHondurasHong Kong SAR, ChinaHungaryIBRD onlyIcelandIDA & IBRD totalIDA blendIDA onlyIDA totalIndiaIndonesiaIran, Islamic Rep.IraqIrelandIsraelItalyJamaicaJapanJordanKazakhstanKenyaKiribatiKorea, Dem. People’s Rep.Korea, Rep.KuwaitKyrgyz RepublicLao PDRLate-demographic dividendLatin America & Caribbean Latin America & Caribbean (excluding high income)Latin America & the Caribbean (IDA & IBRD countries)LatviaLeast developed countries: UN classificationLebanonLesothoLiberiaLibyaLiechtensteinLithuaniaLow & middle incomeLow incomeLower middle incomeLuxembourgMacao SAR, ChinaMacedonia, FYRMadagascarMalawiMaldivesMaliMaltaMarshall IslandsMauritaniaMauritiusMexicoMiddle East & North AfricaMiddle East & North Africa (excluding high income)Middle East & North Africa (IDA & IBRD countries)Middle incomeMoldovaMongoliaMontenegroMoroccoMozambiqueMyanmarNamibiaNauruNepalNetherlandsNew ZealandNicaraguaNigerNigeriaNorwayOECD membersOmanOther small statesPacific island small statesPakistanPalauPanamaPapua New GuineaParaguayPeruPhilippinesPolandPortugalPost-demographic dividendPre-demographic dividendQatarRomaniaRussian FederationRwandaSamoaSan MarinoSao Tome and PrincipeSaudi ArabiaSenegalSerbiaSeychellesSierra LeoneSlovak RepublicSloveniaSmall statesSolomon IslandsSouth AfricaSouth AsiaSouth Asia (IDA & IBRD)South SudanSpainSri LankaSt. Kitts and NevisSt. LuciaSt. Vincent and the GrenadinesSub-Saharan Africa Sub-Saharan Africa (excluding high income)Sub-Saharan Africa (IDA & IBRD countries)SudanSurinameSwazilandSwedenSwitzerlandSyrian Arab RepublicTajikistanTanzaniaThailandTimor-LesteTogoTongaTrinidad and TobagoTunisiaTurkeyTuvaluUgandaUkraineUnited Arab EmiratesUpper middle incomeUruguayUzbekistanVanuatuVenezuela, RBVietnamWest Bank and GazaWorldYemen, Rep.ZambiaZimbabwe línea de tiempo (timeline):
En esta escala de tiempo se presenta un gráfico de 1975 y 2015 de Latin America & the Caribbean (IDA & IBRD countries). Los datos de 1974 están ausentes. El número de observaciones reales por fecha: 41.
Fuente (nombre):
Indicadores del desarrollo mundial
Fuente (organización):
United Nations Educational, Scientific, and Cultural Organization (UNESCO) Institute for Statistics.
Categorías:
Education, Gender
Se ha actualizado:
23 abr 2017 año
Los indicadores de los cambios de valor en los últimos años
Mínimo:
82.163
1 ene 1975 año
Máximo:
100.493
1 ene 2013 año
A la fecha de observación
Valor
Cambio absoluto
El cambio con respecto al valor anterior
1 ene 1975 año
82.163
+82.163
0.0%
1 ene 1976 año
82.43
+0.267
0.33%
1 ene 1977 año
83.035
+0.606
0.73%
1 ene 1978 año
84.61
+1.575
1.9%
1 ene 1979 año
84.797
+0.186
0.22%
1 ene 1980 año
85.785
+0.988
1.17%
1 ene 1981 año
87.125
+1.34
1.56%
1 ene 1982 año
87.854
+0.729
0.84%
1 ene 1983 año
88.48
+0.626
0.71%
1 ene 1984 año
89.297
+0.817
0.92%
1 ene 1985 año
90.193
+0.896
1.0%
1 ene 1986 año
89.866
-0.327
-0.36%
1 ene 1987 año
90.385
+0.52
0.58%
1 ene 1988 año
91.341
+0.956
1.06%
1 ene 1989 año
91.611
+0.271
0.3%
1 ene 1990 año
91.626
+0.015
0.02%
1 ene 1991 año
92.583
+0.957
1.04%
1 ene 1992 año
91.983
-0.6
-0.65%
1 ene 1993 año
93.935
+1.952
2.12%
1 ene 1994 año
94.412
+0.477
0.51%
1 ene 1995 año
94.662
+0.25
0.27%
1 ene 1996 año
95.106
+0.443
0.47%
1 ene 1997 año
95.617
+0.512
0.54%
1 ene 1998 año
95.954
+0.336
0.35%
1 ene 1999 año
96.606
+0.653
0.68%
1 ene 2000 año
97.004
+0.397
0.41%
1 ene 2001 año
97.994
+0.99
1.02%
1 ene 2002 año
98.017
+0.023
0.02%
1 ene 2003 año
100.07
+2.052
2.09%
1 ene 2004 año
99.05
-1.019
-1.02%
1 ene 2005 año
97.191
-1.859
-1.88%
1 ene 2006 año
98.09
+0.899
0.92%
1 ene 2007 año
99.15
+1.06
1.08%
1 ene 2008 año
100.061
+0.91
0.92%
1 ene 2009 año
99.822
-0.239
-0.24%
1 ene 2010 año
99.634
-0.187
-0.19%
1 ene 2011 año
99.577
-0.057
-0.06%
1 ene 2012 año
99.696
+0.119
0.12%
1 ene 2013 año
100.493
+0.797
0.8%
1 ene 2014 año
100.163
-0.33
-0.33%
1 ene 2015 año
100.31
+0.146
0.15%
Ranking de los países por los datos estadísticos actuales


Comentarios: