29
/es/
es
AIzaSyAYiBZKx7MnpbEhh9jyipgxe19OcubqV5w
April 1, 2024
95308
Burkina Faso
BFA
true
2
1
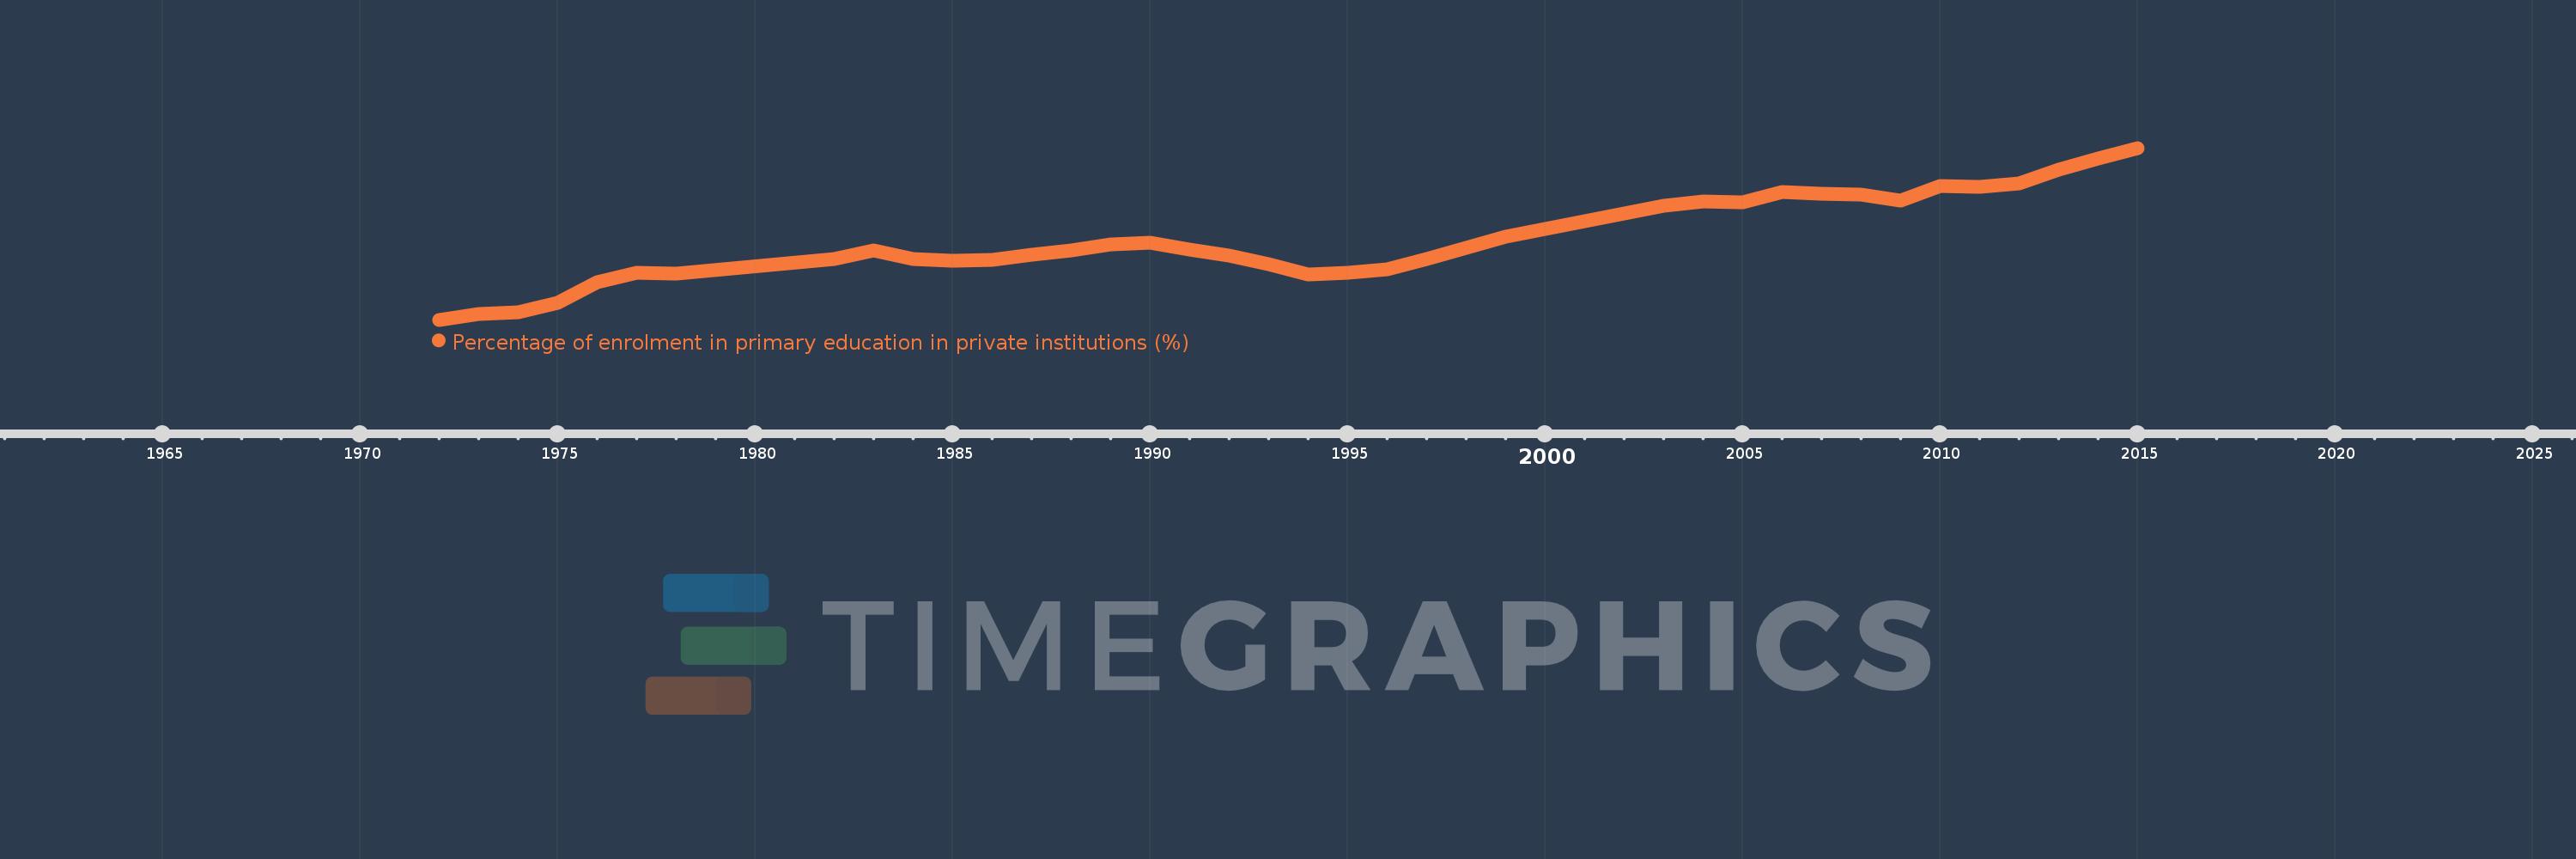
Percentage of enrolment in primary education in private institutions (%)
2015,2014,2013,2012,2011,2010,2009,2008,2007,2006,2005,2004,2003,2002,2001,2000,1999,1997,1996,1995,1994,1993,1992,1991,1990,1989,1988,1987,1986,1985,1984,1983,1982,1978,1977,1976,1975,1974,1973,1972
Estas estadísticas en otros países:
AfghanistanAlbaniaAlgeriaAndorraAngolaAntigua and BarbudaArab WorldArgentinaArmeniaArubaAustraliaAustriaAzerbaijanBahamas, TheBahrainBangladeshBarbadosBelarusBelgiumBelizeBeninBermudaBhutanBoliviaBosnia and HerzegovinaBotswanaBrazilBritish Virgin IslandsBrunei DarussalamBulgariaBurkina FasoBurundiCabo VerdeCambodiaCameroonCanadaCaribbean small statesCayman IslandsCentral African RepublicCentral Europe and the BalticsChadChileChinaColombiaComorosCongo, Dem. Rep.Congo, Rep.Costa RicaCote d'IvoireCroatiaCubaCuracaoCyprusCzech RepublicDenmarkDjiboutiDominicaDominican RepublicEarly-demographic dividendEast Asia & PacificEast Asia & Pacific (excluding high income)East Asia & Pacific (IDA & IBRD countries)EcuadorEgypt, Arab Rep.El SalvadorEquatorial GuineaEritreaEstoniaEthiopiaEuro areaEurope & Central AsiaEurope & Central Asia (excluding high income)Europe & Central Asia (IDA & IBRD countries)European UnionFijiFinlandFragile and conflict affected situationsFranceGabonGambia, TheGeorgiaGermanyGhanaGibraltarGreeceGrenadaGuatemalaGuineaGuinea-BissauGuyanaHaitiHeavily indebted poor countries (HIPC)High incomeHondurasHong Kong SAR, ChinaHungaryIBRD onlyIcelandIDA & IBRD totalIDA blendIDA onlyIDA totalIndiaIndonesiaIran, Islamic Rep.IraqIrelandIsraelItalyJamaicaJapanJordanKazakhstanKenyaKiribatiKorea, Rep.KuwaitKyrgyz RepublicLao PDRLate-demographic dividendLatin America & Caribbean Latin America & Caribbean (excluding high income)Latin America & the Caribbean (IDA & IBRD countries)LatviaLeast developed countries: UN classificationLebanonLesothoLiberiaLibyaLiechtensteinLithuaniaLow & middle incomeLow incomeLower middle incomeLuxembourgMacao SAR, ChinaMacedonia, FYRMadagascarMalawiMalaysiaMaldivesMaliMaltaMarshall IslandsMauritaniaMauritiusMexicoMiddle East & North AfricaMiddle East & North Africa (excluding high income)Middle East & North Africa (IDA & IBRD countries)Middle incomeMoldovaMonacoMongoliaMoroccoMozambiqueMyanmarNamibiaNauruNepalNetherlandsNew ZealandNicaraguaNigerNigeriaNorth AmericaNorwayOECD membersOmanOther small statesPacific island small statesPakistanPalauPanamaPapua New GuineaParaguayPeruPhilippinesPolandPortugalPost-demographic dividendPre-demographic dividendPuerto RicoQatarRomaniaRussian FederationRwandaSamoaSan MarinoSao Tome and PrincipeSaudi ArabiaSenegalSerbiaSeychellesSierra LeoneSingaporeSlovak RepublicSloveniaSmall statesSolomon IslandsSomaliaSouth AfricaSouth AsiaSouth Asia (IDA & IBRD)SpainSri LankaSt. Kitts and NevisSt. LuciaSt. Vincent and the GrenadinesSub-Saharan Africa Sub-Saharan Africa (excluding high income)Sub-Saharan Africa (IDA & IBRD countries)SudanSurinameSwazilandSwedenSwitzerlandSyrian Arab RepublicTajikistanTanzaniaThailandTimor-LesteTogoTongaTrinidad and TobagoTunisiaTurkeyTurks and Caicos IslandsTuvaluUgandaUkraineUnited Arab EmiratesUnited KingdomUnited StatesUpper middle incomeUruguayVanuatuVenezuela, RBVietnamWest Bank and GazaWorldYemen, Rep.ZambiaZimbabwe línea de tiempo (timeline):
En esta escala de tiempo se presenta un gráfico de 1972 y 2015 de Burkina Faso. Los datos de 1971 están ausentes. El número de observaciones reales por fecha: 40.
Fuente (nombre):
Indicadores del desarrollo mundial
Fuente (organización):
UNESCO Institute for Statistics
Categorías:
Education
Se ha actualizado:
23 abr 2017 año
Los indicadores de los cambios de valor en los últimos años
Mínimo:
3.498
1 ene 1972 año
Máximo:
17.316
1 ene 2015 año
A la fecha de observación
Valor
Cambio absoluto
El cambio con respecto al valor anterior
1 ene 1972 año
3.498
+3.498
0.0%
1 ene 1973 año
3.93
+0.433
12.37%
1 ene 1974 año
4.129
+0.199
5.05%
1 ene 1975 año
4.866
+0.737
17.85%
1 ene 1976 año
6.534
+1.668
34.29%
1 ene 1977 año
7.244
+0.71
10.86%
1 ene 1978 año
7.187
-0.057
-0.79%
1 ene 1982 año
8.386
+1.199
16.68%
1 ene 1983 año
9.089
+0.702
8.38%
1 ene 1984 año
8.395
-0.693
-7.63%
1 ene 1985 año
8.241
-0.154
-1.84%
1 ene 1986 año
8.285
+0.044
0.54%
1 ene 1987 año
8.719
+0.434
5.24%
1 ene 1988 año
9.077
+0.358
4.11%
1 ene 1989 año
9.589
+0.512
5.64%
1 ene 1990 año
9.678
+0.089
0.93%
1 ene 1991 año
9.118
-0.56
-5.79%
1 ene 1992 año
8.649
-0.469
-5.14%
1 ene 1993 año
7.961
-0.689
-7.96%
1 ene 1994 año
7.132
-0.829
-10.41%
1 ene 1995 año
7.289
+0.157
2.2%
1 ene 1996 año
7.581
+0.292
4.0%
1 ene 1997 año
8.411
+0.831
10.96%
1 ene 1999 año
10.178
+1.766
21.0%
1 ene 2000 año
10.828
+0.651
6.4%
1 ene 2001 año
11.391
+0.563
5.2%
1 ene 2002 año
12.028
+0.637
5.6%
1 ene 2003 año
12.673
+0.644
5.36%
1 ene 2004 año
13.036
+0.363
2.86%
1 ene 2005 año
12.963
-0.072
-0.55%
1 ene 2006 año
13.751
+0.788
6.08%
1 ene 2007 año
13.656
-0.096
-0.7%
1 ene 2008 año
13.581
-0.075
-0.55%
1 ene 2009 año
13.098
-0.483
-3.56%
1 ene 2010 año
14.229
+1.131
8.64%
1 ene 2011 año
14.166
-0.063
-0.44%
1 ene 2012 año
14.477
+0.311
2.2%
1 ene 2013 año
15.571
+1.094
7.56%
1 ene 2014 año
16.483
+0.912
5.85%
1 ene 2015 año
17.316
+0.834
5.06%
Ranking de los países por los datos estadísticos actuales


Comentarios: