29
/es/
es
AIzaSyAYiBZKx7MnpbEhh9jyipgxe19OcubqV5w
April 1, 2024
24409
Arab World
ARB
false
2
1
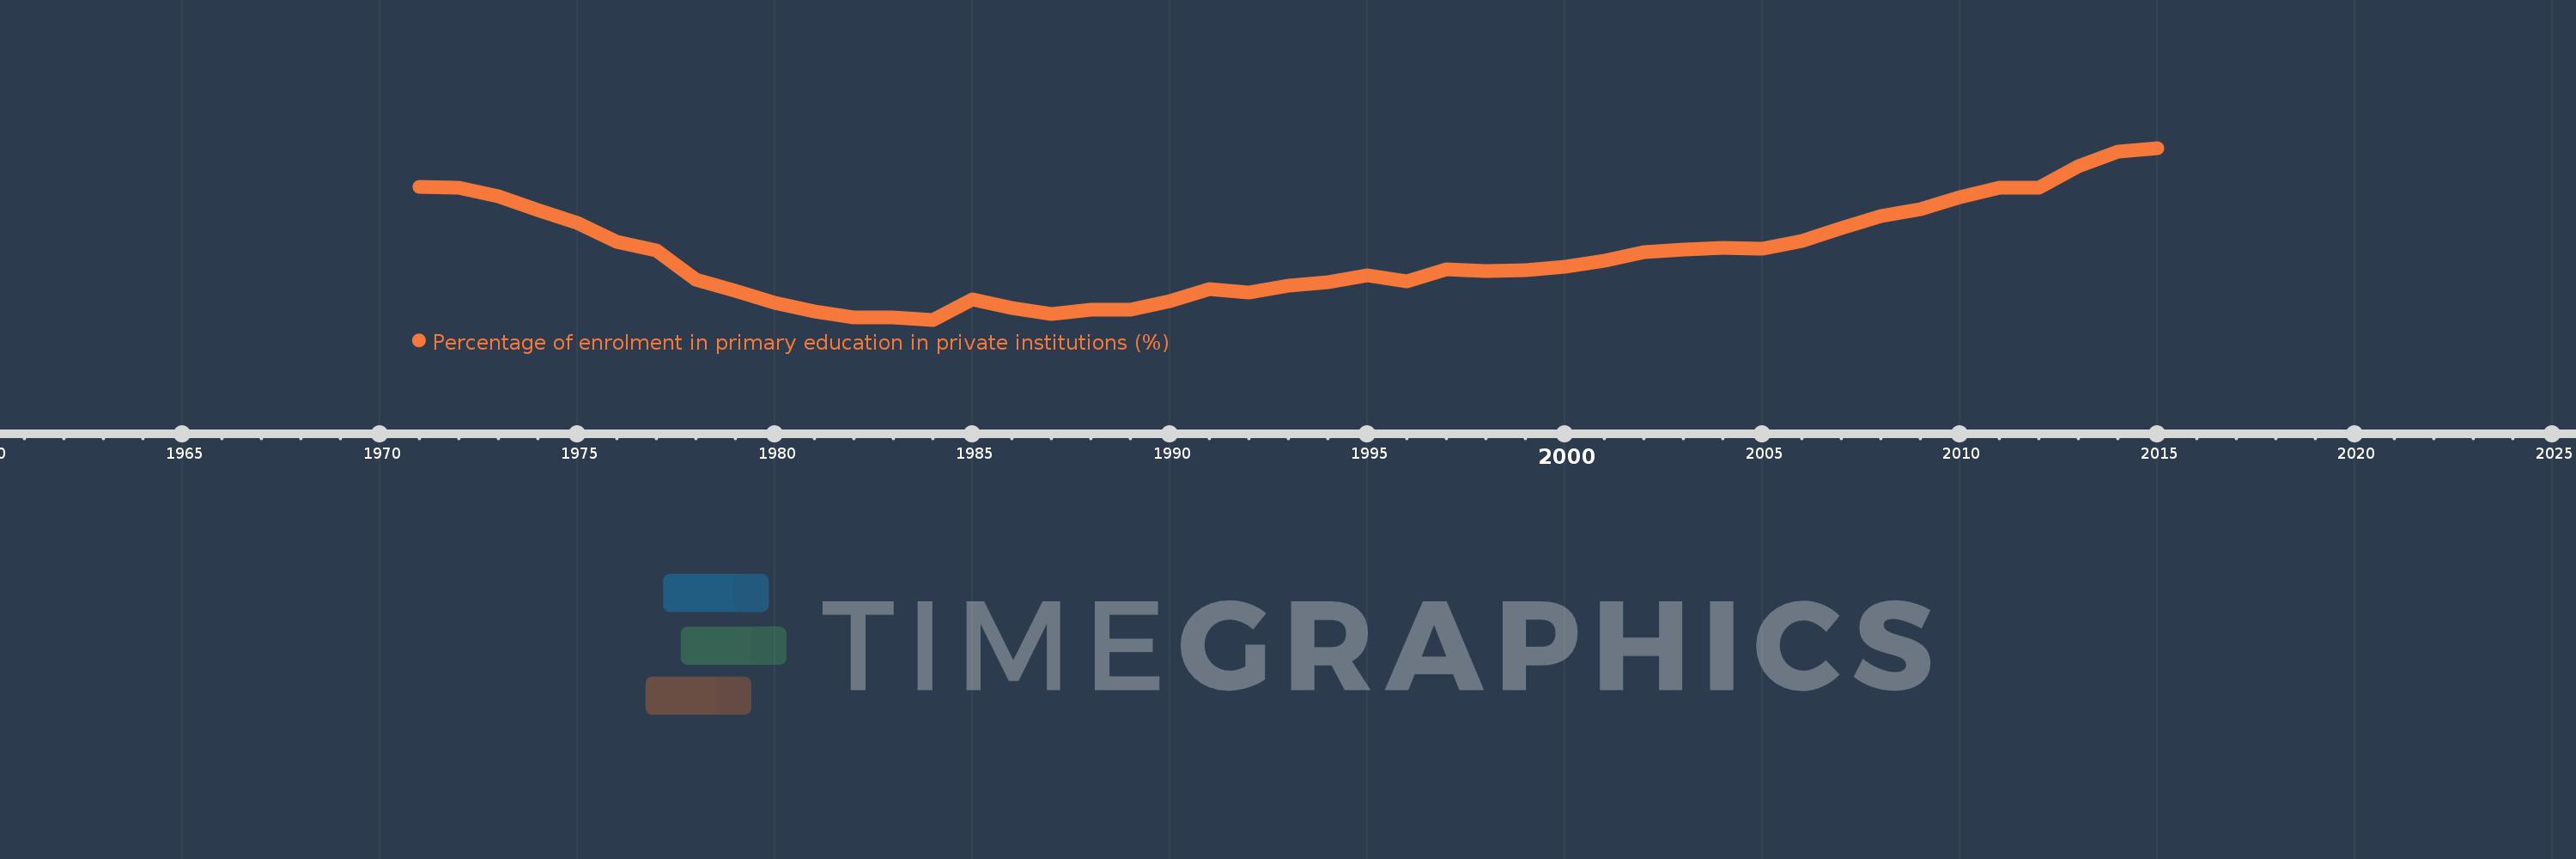
Percentage of enrolment in primary education in private institutions (%)
2015,2014,2013,2012,2011,2010,2009,2008,2007,2006,2005,2004,2003,2002,2001,2000,1999,1998,1997,1996,1995,1994,1993,1992,1991,1990,1989,1988,1987,1986,1985,1984,1983,1982,1981,1980,1979,1978,1977,1976,1975,1974,1973,1972,1971
Estas estadísticas en otros países:
AfghanistanAlbaniaAlgeriaAndorraAngolaAntigua and BarbudaArab WorldArgentinaArmeniaArubaAustraliaAustriaAzerbaijanBahamas, TheBahrainBangladeshBarbadosBelarusBelgiumBelizeBeninBermudaBhutanBoliviaBosnia and HerzegovinaBotswanaBrazilBritish Virgin IslandsBrunei DarussalamBulgariaBurkina FasoBurundiCabo VerdeCambodiaCameroonCanadaCaribbean small statesCayman IslandsCentral African RepublicCentral Europe and the BalticsChadChileChinaColombiaComorosCongo, Dem. Rep.Congo, Rep.Costa RicaCote d'IvoireCroatiaCubaCuracaoCyprusCzech RepublicDenmarkDjiboutiDominicaDominican RepublicEarly-demographic dividendEast Asia & PacificEast Asia & Pacific (excluding high income)East Asia & Pacific (IDA & IBRD countries)EcuadorEgypt, Arab Rep.El SalvadorEquatorial GuineaEritreaEstoniaEthiopiaEuro areaEurope & Central AsiaEurope & Central Asia (excluding high income)Europe & Central Asia (IDA & IBRD countries)European UnionFijiFinlandFragile and conflict affected situationsFranceGabonGambia, TheGeorgiaGermanyGhanaGibraltarGreeceGrenadaGuatemalaGuineaGuinea-BissauGuyanaHaitiHeavily indebted poor countries (HIPC)High incomeHondurasHong Kong SAR, ChinaHungaryIBRD onlyIcelandIDA & IBRD totalIDA blendIDA onlyIDA totalIndiaIndonesiaIran, Islamic Rep.IraqIrelandIsraelItalyJamaicaJapanJordanKazakhstanKenyaKiribatiKorea, Rep.KuwaitKyrgyz RepublicLao PDRLate-demographic dividendLatin America & Caribbean Latin America & Caribbean (excluding high income)Latin America & the Caribbean (IDA & IBRD countries)LatviaLeast developed countries: UN classificationLebanonLesothoLiberiaLibyaLiechtensteinLithuaniaLow & middle incomeLow incomeLower middle incomeLuxembourgMacao SAR, ChinaMacedonia, FYRMadagascarMalawiMalaysiaMaldivesMaliMaltaMarshall IslandsMauritaniaMauritiusMexicoMiddle East & North AfricaMiddle East & North Africa (excluding high income)Middle East & North Africa (IDA & IBRD countries)Middle incomeMoldovaMonacoMongoliaMoroccoMozambiqueMyanmarNamibiaNauruNepalNetherlandsNew ZealandNicaraguaNigerNigeriaNorth AmericaNorwayOECD membersOmanOther small statesPacific island small statesPakistanPalauPanamaPapua New GuineaParaguayPeruPhilippinesPolandPortugalPost-demographic dividendPre-demographic dividendPuerto RicoQatarRomaniaRussian FederationRwandaSamoaSan MarinoSao Tome and PrincipeSaudi ArabiaSenegalSerbiaSeychellesSierra LeoneSingaporeSlovak RepublicSloveniaSmall statesSolomon IslandsSomaliaSouth AfricaSouth AsiaSouth Asia (IDA & IBRD)SpainSri LankaSt. Kitts and NevisSt. LuciaSt. Vincent and the GrenadinesSub-Saharan Africa Sub-Saharan Africa (excluding high income)Sub-Saharan Africa (IDA & IBRD countries)SudanSurinameSwazilandSwedenSwitzerlandSyrian Arab RepublicTajikistanTanzaniaThailandTimor-LesteTogoTongaTrinidad and TobagoTunisiaTurkeyTurks and Caicos IslandsTuvaluUgandaUkraineUnited Arab EmiratesUnited KingdomUnited StatesUpper middle incomeUruguayVanuatuVenezuela, RBVietnamWest Bank and GazaWorldYemen, Rep.ZambiaZimbabwe línea de tiempo (timeline):
En esta escala de tiempo se presenta un gráfico de 1971 y 2015 de Arab World. Los datos de 1970 están ausentes. El número de observaciones reales por fecha: 45.
Fuente (nombre):
Indicadores del desarrollo mundial
Fuente (organización):
UNESCO Institute for Statistics
Categorías:
Education
Se ha actualizado:
23 abr 2017 año
Los indicadores de los cambios de valor en los últimos años
Mínimo:
4.155
1 ene 1984 año
Máximo:
8.906
1 ene 2015 año
A la fecha de observación
Valor
Cambio absoluto
El cambio con respecto al valor anterior
1 ene 1971 año
7.828
+7.828
0.0%
1 ene 1972 año
7.8
-0.028
-0.36%
1 ene 1973 año
7.563
-0.237
-3.04%
1 ene 1974 año
7.196
-0.368
-4.86%
1 ene 1975 año
6.829
-0.366
-5.09%
1 ene 1976 año
6.319
-0.51
-7.47%
1 ene 1977 año
6.065
-0.254
-4.01%
1 ene 1978 año
5.27
-0.795
-13.11%
1 ene 1979 año
4.951
-0.319
-6.05%
1 ene 1980 año
4.617
-0.335
-6.76%
1 ene 1981 año
4.376
-0.241
-5.21%
1 ene 1982 año
4.212
-0.164
-3.74%
1 ene 1983 año
4.216
+0.004
0.09%
1 ene 1984 año
4.155
-0.061
-1.44%
1 ene 1985 año
4.709
+0.554
13.33%
1 ene 1986 año
4.478
-0.231
-4.9%
1 ene 1987 año
4.326
-0.153
-3.41%
1 ene 1988 año
4.443
+0.118
2.72%
1 ene 1989 año
4.426
-0.017
-0.39%
1 ene 1990 año
4.661
+0.235
5.3%
1 ene 1991 año
5.003
+0.342
7.34%
1 ene 1992 año
4.906
-0.097
-1.93%
1 ene 1993 año
5.103
+0.197
4.01%
1 ene 1994 año
5.204
+0.101
1.99%
1 ene 1995 año
5.375
+0.17
3.27%
1 ene 1996 año
5.209
-0.165
-3.07%
1 ene 1997 año
5.542
+0.333
6.38%
1 ene 1998 año
5.496
-0.045
-0.82%
1 ene 1999 año
5.515
+0.018
0.33%
1 ene 2000 año
5.616
+0.101
1.83%
1 ene 2001 año
5.785
+0.169
3.02%
1 ene 2002 año
6.035
+0.25
4.31%
1 ene 2003 año
6.09
+0.056
0.93%
1 ene 2004 año
6.146
+0.056
0.92%
1 ene 2005 año
6.116
-0.031
-0.5%
1 ene 2006 año
6.325
+0.21
3.43%
1 ene 2007 año
6.693
+0.367
5.81%
1 ene 2008 año
7.024
+0.331
4.95%
1 ene 2009 año
7.222
+0.198
2.81%
1 ene 2010 año
7.546
+0.325
4.5%
1 ene 2011 año
7.797
+0.251
3.33%
1 ene 2012 año
7.816
+0.018
0.23%
1 ene 2013 año
8.399
+0.583
7.46%
1 ene 2014 año
8.799
+0.401
4.77%
1 ene 2015 año
8.906
+0.107
1.21%
Ranking de los países por los datos estadísticos actuales


Comentarios: