29
/es/
es
AIzaSyAYiBZKx7MnpbEhh9jyipgxe19OcubqV5w
April 1, 2024
47503
Lower middle income
LMC
false
2
1
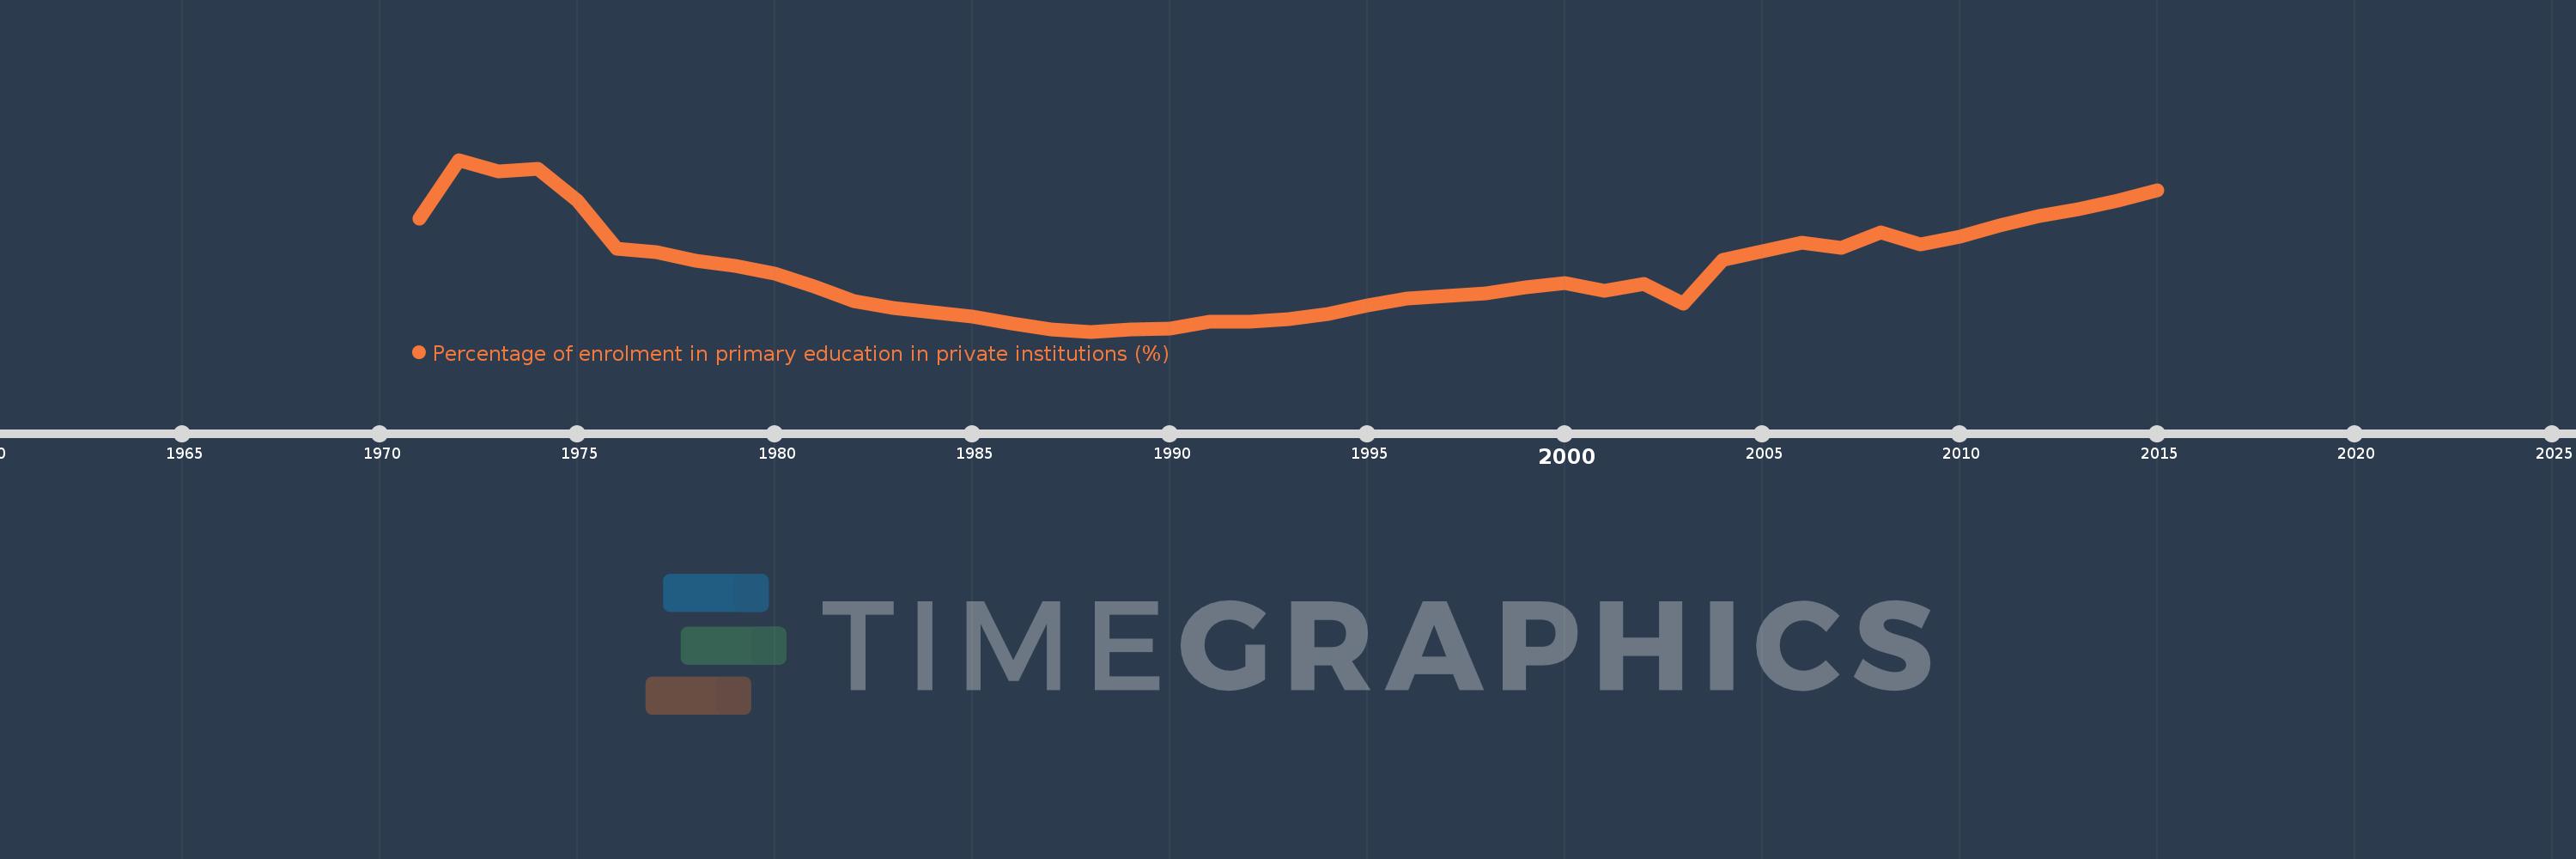
Percentage of enrolment in primary education in private institutions (%)
2015,2014,2013,2012,2011,2010,2009,2008,2007,2006,2005,2004,2003,2002,2001,2000,1999,1998,1997,1996,1995,1994,1993,1992,1991,1990,1989,1988,1987,1986,1985,1984,1983,1982,1981,1980,1979,1978,1977,1976,1975,1974,1973,1972,1971
Estas estadísticas en otros países:
AfghanistanAlbaniaAlgeriaAndorraAngolaAntigua and BarbudaArab WorldArgentinaArmeniaArubaAustraliaAustriaAzerbaijanBahamas, TheBahrainBangladeshBarbadosBelarusBelgiumBelizeBeninBermudaBhutanBoliviaBosnia and HerzegovinaBotswanaBrazilBritish Virgin IslandsBrunei DarussalamBulgariaBurkina FasoBurundiCabo VerdeCambodiaCameroonCanadaCaribbean small statesCayman IslandsCentral African RepublicCentral Europe and the BalticsChadChileChinaColombiaComorosCongo, Dem. Rep.Congo, Rep.Costa RicaCote d'IvoireCroatiaCubaCuracaoCyprusCzech RepublicDenmarkDjiboutiDominicaDominican RepublicEarly-demographic dividendEast Asia & PacificEast Asia & Pacific (excluding high income)East Asia & Pacific (IDA & IBRD countries)EcuadorEgypt, Arab Rep.El SalvadorEquatorial GuineaEritreaEstoniaEthiopiaEuro areaEurope & Central AsiaEurope & Central Asia (excluding high income)Europe & Central Asia (IDA & IBRD countries)European UnionFijiFinlandFragile and conflict affected situationsFranceGabonGambia, TheGeorgiaGermanyGhanaGibraltarGreeceGrenadaGuatemalaGuineaGuinea-BissauGuyanaHaitiHeavily indebted poor countries (HIPC)High incomeHondurasHong Kong SAR, ChinaHungaryIBRD onlyIcelandIDA & IBRD totalIDA blendIDA onlyIDA totalIndiaIndonesiaIran, Islamic Rep.IraqIrelandIsraelItalyJamaicaJapanJordanKazakhstanKenyaKiribatiKorea, Rep.KuwaitKyrgyz RepublicLao PDRLate-demographic dividendLatin America & Caribbean Latin America & Caribbean (excluding high income)Latin America & the Caribbean (IDA & IBRD countries)LatviaLeast developed countries: UN classificationLebanonLesothoLiberiaLibyaLiechtensteinLithuaniaLow & middle incomeLow incomeLower middle incomeLuxembourgMacao SAR, ChinaMacedonia, FYRMadagascarMalawiMalaysiaMaldivesMaliMaltaMarshall IslandsMauritaniaMauritiusMexicoMiddle East & North AfricaMiddle East & North Africa (excluding high income)Middle East & North Africa (IDA & IBRD countries)Middle incomeMoldovaMonacoMongoliaMoroccoMozambiqueMyanmarNamibiaNauruNepalNetherlandsNew ZealandNicaraguaNigerNigeriaNorth AmericaNorwayOECD membersOmanOther small statesPacific island small statesPakistanPalauPanamaPapua New GuineaParaguayPeruPhilippinesPolandPortugalPost-demographic dividendPre-demographic dividendPuerto RicoQatarRomaniaRussian FederationRwandaSamoaSan MarinoSao Tome and PrincipeSaudi ArabiaSenegalSerbiaSeychellesSierra LeoneSingaporeSlovak RepublicSloveniaSmall statesSolomon IslandsSomaliaSouth AfricaSouth AsiaSouth Asia (IDA & IBRD)SpainSri LankaSt. Kitts and NevisSt. LuciaSt. Vincent and the GrenadinesSub-Saharan Africa Sub-Saharan Africa (excluding high income)Sub-Saharan Africa (IDA & IBRD countries)SudanSurinameSwazilandSwedenSwitzerlandSyrian Arab RepublicTajikistanTanzaniaThailandTimor-LesteTogoTongaTrinidad and TobagoTunisiaTurkeyTurks and Caicos IslandsTuvaluUgandaUkraineUnited Arab EmiratesUnited KingdomUnited StatesUpper middle incomeUruguayVanuatuVenezuela, RBVietnamWest Bank and GazaWorldYemen, Rep.ZambiaZimbabwe línea de tiempo (timeline):
En esta escala de tiempo se presenta un gráfico de 1971 y 2015 de Lower middle income. Los datos de 1970 están ausentes. El número de observaciones reales por fecha: 45.
Fuente (nombre):
Indicadores del desarrollo mundial
Fuente (organización):
UNESCO Institute for Statistics
Categorías:
Education
Se ha actualizado:
23 abr 2017 año
Los indicadores de los cambios de valor en los últimos años
Mínimo:
13.562
1 ene 1988 año
Máximo:
17.068
1 ene 1972 año
A la fecha de observación
Valor
Cambio absoluto
El cambio con respecto al valor anterior
1 ene 1971 año
15.866
+15.866
0.0%
1 ene 1972 año
17.068
+1.202
7.57%
1 ene 1973 año
16.837
-0.232
-1.36%
1 ene 1974 año
16.88
+0.044
0.26%
1 ene 1975 año
16.227
-0.654
-3.87%
1 ene 1976 año
15.251
-0.976
-6.01%
1 ene 1977 año
15.189
-0.062
-0.41%
1 ene 1978 año
15.005
-0.184
-1.21%
1 ene 1979 año
14.896
-0.109
-0.73%
1 ene 1980 año
14.752
-0.144
-0.97%
1 ene 1981 año
14.478
-0.273
-1.85%
1 ene 1982 año
14.187
-0.292
-2.01%
1 ene 1983 año
14.038
-0.149
-1.05%
1 ene 1984 año
13.956
-0.082
-0.59%
1 ene 1985 año
13.874
-0.082
-0.59%
1 ene 1986 año
13.727
-0.147
-1.06%
1 ene 1987 año
13.602
-0.125
-0.91%
1 ene 1988 año
13.562
-0.04
-0.29%
1 ene 1989 año
13.614
+0.052
0.39%
1 ene 1990 año
13.619
+0.004
0.03%
1 ene 1991 año
13.76
+0.141
1.04%
1 ene 1992 año
13.763
+0.003
0.02%
1 ene 1993 año
13.816
+0.052
0.38%
1 ene 1994 año
13.925
+0.109
0.79%
1 ene 1995 año
14.099
+0.174
1.25%
1 ene 1996 año
14.233
+0.134
0.95%
1 ene 1997 año
14.289
+0.056
0.39%
1 ene 1998 año
14.344
+0.054
0.38%
1 ene 1999 año
14.465
+0.121
0.85%
1 ene 2000 año
14.551
+0.086
0.6%
1 ene 2001 año
14.387
-0.164
-1.13%
1 ene 2002 año
14.531
+0.144
1.0%
1 ene 2003 año
14.138
-0.393
-2.7%
1 ene 2004 año
15.02
+0.881
6.23%
1 ene 2005 año
15.206
+0.186
1.24%
1 ene 2006 año
15.379
+0.173
1.14%
1 ene 2007 año
15.273
-0.106
-0.69%
1 ene 2008 año
15.595
+0.322
2.11%
1 ene 2009 año
15.344
-0.251
-1.61%
1 ene 2010 año
15.504
+0.16
1.04%
1 ene 2011 año
15.731
+0.227
1.46%
1 ene 2012 año
15.924
+0.194
1.23%
1 ene 2013 año
16.065
+0.14
0.88%
1 ene 2014 año
16.231
+0.166
1.03%
1 ene 2015 año
16.443
+0.213
1.31%
Ranking de los países por los datos estadísticos actuales


Comentarios: