29
/es/
es
AIzaSyAYiBZKx7MnpbEhh9jyipgxe19OcubqV5w
April 1, 2024
196025
Mexico
MEX
true
2
1
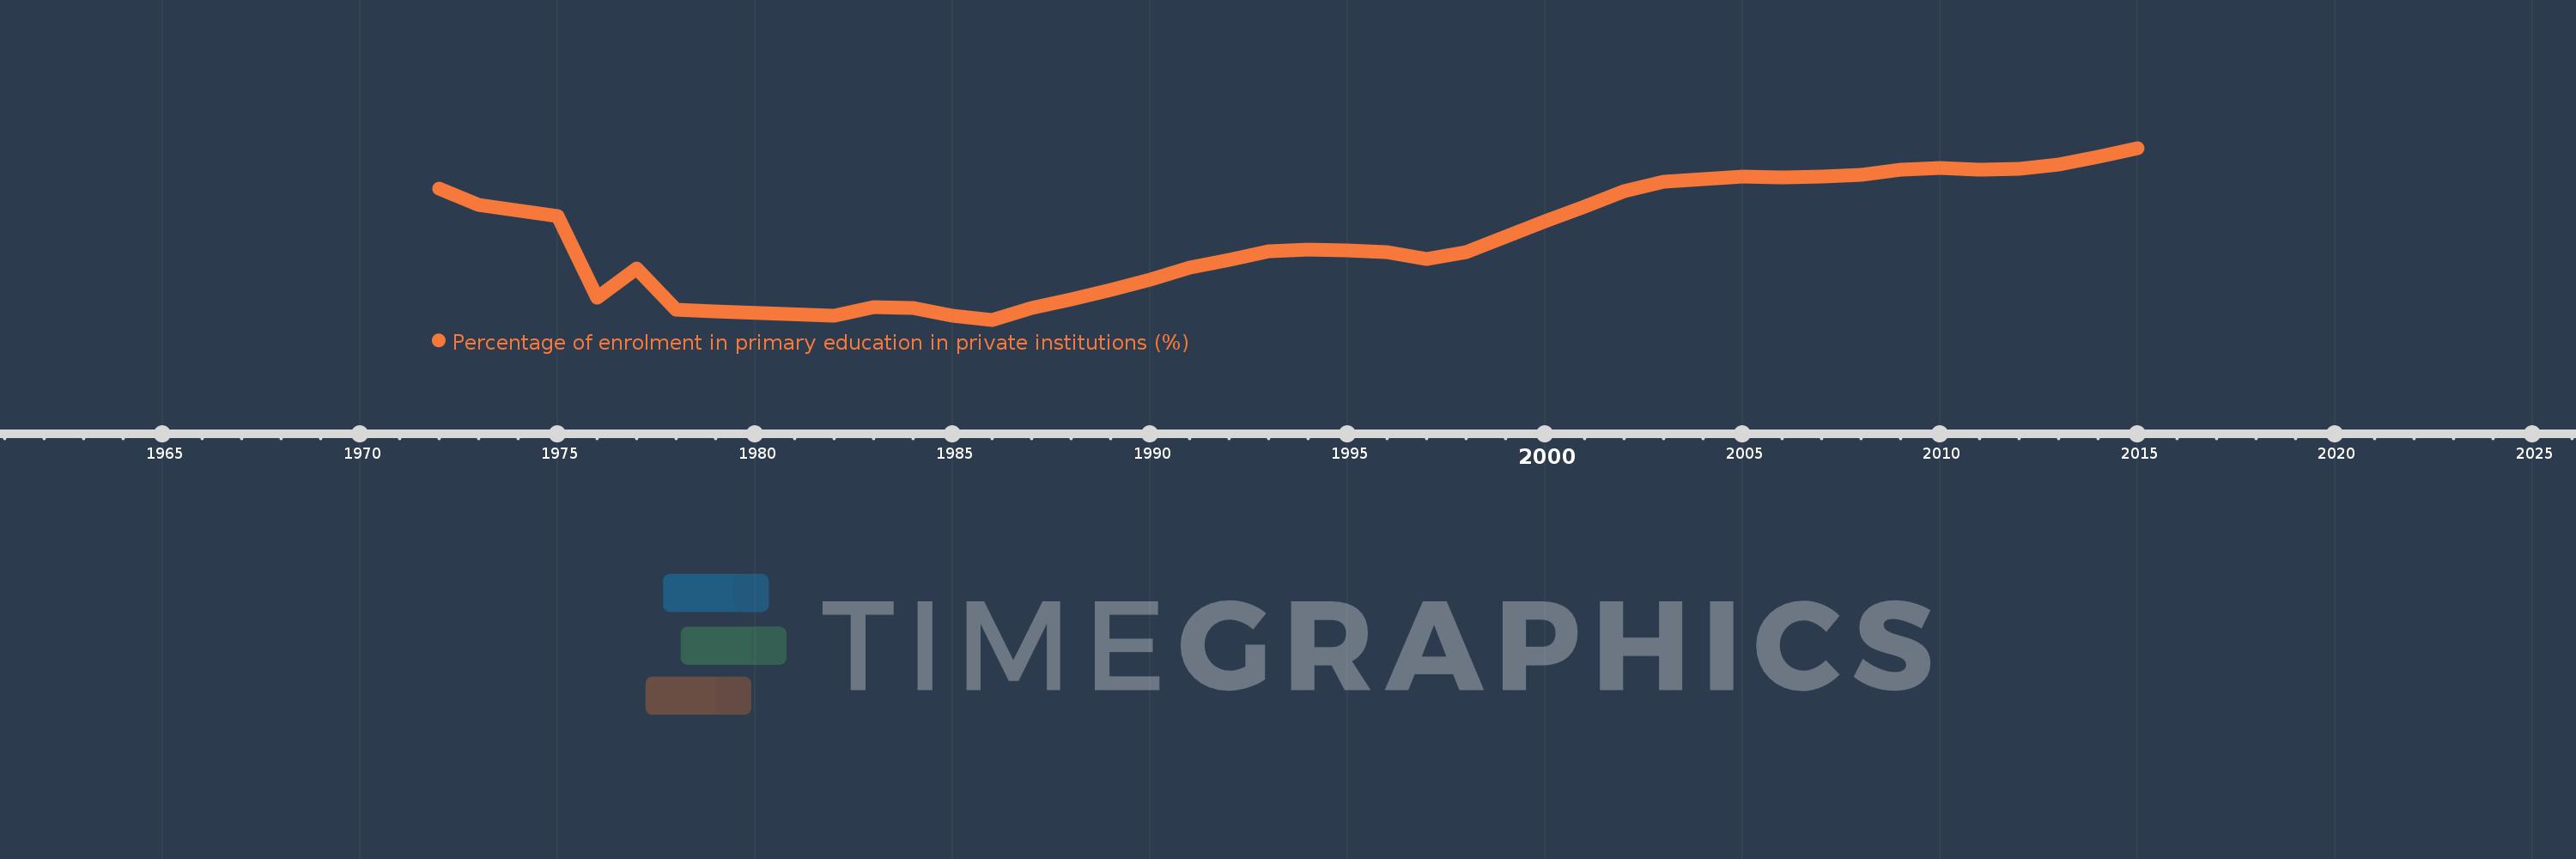
Percentage of enrolment in primary education in private institutions (%)
2015,2014,2013,2012,2011,2010,2009,2008,2007,2006,2005,2004,2003,2002,2001,2000,1998,1997,1996,1995,1994,1993,1992,1991,1990,1989,1988,1987,1986,1985,1984,1983,1982,1979,1978,1977,1976,1975,1973,1972
Estas estadísticas en otros países:
AfghanistanAlbaniaAlgeriaAndorraAngolaAntigua and BarbudaArab WorldArgentinaArmeniaArubaAustraliaAustriaAzerbaijanBahamas, TheBahrainBangladeshBarbadosBelarusBelgiumBelizeBeninBermudaBhutanBoliviaBosnia and HerzegovinaBotswanaBrazilBritish Virgin IslandsBrunei DarussalamBulgariaBurkina FasoBurundiCabo VerdeCambodiaCameroonCanadaCaribbean small statesCayman IslandsCentral African RepublicCentral Europe and the BalticsChadChileChinaColombiaComorosCongo, Dem. Rep.Congo, Rep.Costa RicaCote d'IvoireCroatiaCubaCuracaoCyprusCzech RepublicDenmarkDjiboutiDominicaDominican RepublicEarly-demographic dividendEast Asia & PacificEast Asia & Pacific (excluding high income)East Asia & Pacific (IDA & IBRD countries)EcuadorEgypt, Arab Rep.El SalvadorEquatorial GuineaEritreaEstoniaEthiopiaEuro areaEurope & Central AsiaEurope & Central Asia (excluding high income)Europe & Central Asia (IDA & IBRD countries)European UnionFijiFinlandFragile and conflict affected situationsFranceGabonGambia, TheGeorgiaGermanyGhanaGibraltarGreeceGrenadaGuatemalaGuineaGuinea-BissauGuyanaHaitiHeavily indebted poor countries (HIPC)High incomeHondurasHong Kong SAR, ChinaHungaryIBRD onlyIcelandIDA & IBRD totalIDA blendIDA onlyIDA totalIndiaIndonesiaIran, Islamic Rep.IraqIrelandIsraelItalyJamaicaJapanJordanKazakhstanKenyaKiribatiKorea, Rep.KuwaitKyrgyz RepublicLao PDRLate-demographic dividendLatin America & Caribbean Latin America & Caribbean (excluding high income)Latin America & the Caribbean (IDA & IBRD countries)LatviaLeast developed countries: UN classificationLebanonLesothoLiberiaLibyaLiechtensteinLithuaniaLow & middle incomeLow incomeLower middle incomeLuxembourgMacao SAR, ChinaMacedonia, FYRMadagascarMalawiMalaysiaMaldivesMaliMaltaMarshall IslandsMauritaniaMauritiusMexicoMiddle East & North AfricaMiddle East & North Africa (excluding high income)Middle East & North Africa (IDA & IBRD countries)Middle incomeMoldovaMonacoMongoliaMoroccoMozambiqueMyanmarNamibiaNauruNepalNetherlandsNew ZealandNicaraguaNigerNigeriaNorth AmericaNorwayOECD membersOmanOther small statesPacific island small statesPakistanPalauPanamaPapua New GuineaParaguayPeruPhilippinesPolandPortugalPost-demographic dividendPre-demographic dividendPuerto RicoQatarRomaniaRussian FederationRwandaSamoaSan MarinoSao Tome and PrincipeSaudi ArabiaSenegalSerbiaSeychellesSierra LeoneSingaporeSlovak RepublicSloveniaSmall statesSolomon IslandsSomaliaSouth AfricaSouth AsiaSouth Asia (IDA & IBRD)SpainSri LankaSt. Kitts and NevisSt. LuciaSt. Vincent and the GrenadinesSub-Saharan Africa Sub-Saharan Africa (excluding high income)Sub-Saharan Africa (IDA & IBRD countries)SudanSurinameSwazilandSwedenSwitzerlandSyrian Arab RepublicTajikistanTanzaniaThailandTimor-LesteTogoTongaTrinidad and TobagoTunisiaTurkeyTurks and Caicos IslandsTuvaluUgandaUkraineUnited Arab EmiratesUnited KingdomUnited StatesUpper middle incomeUruguayVanuatuVenezuela, RBVietnamWest Bank and GazaWorldYemen, Rep.ZambiaZimbabwe línea de tiempo (timeline):
En esta escala de tiempo se presenta un gráfico de 1972 y 2015 de Mexico. Los datos de 1971 están ausentes. El número de observaciones reales por fecha: 40.
Fuente (nombre):
Indicadores del desarrollo mundial
Fuente (organización):
UNESCO Institute for Statistics
Categorías:
Education
Se ha actualizado:
23 abr 2017 año
Los indicadores de los cambios de valor en los últimos años
Mínimo:
4.779
1 ene 1986 año
Máximo:
8.731
1 ene 2015 año
A la fecha de observación
Valor
Cambio absoluto
El cambio con respecto al valor anterior
1 ene 1972 año
7.804
+7.804
0.0%
1 ene 1973 año
7.419
-0.385
-4.93%
1 ene 1975 año
7.158
-0.261
-3.52%
1 ene 1976 año
5.279
-1.879
-26.25%
1 ene 1977 año
5.952
+0.673
12.75%
1 ene 1978 año
5.001
-0.951
-15.97%
1 ene 1979 año
4.974
-0.027
-0.54%
1 ene 1982 año
4.874
-0.1
-2.01%
1 ene 1983 año
5.075
+0.201
4.13%
1 ene 1984 año
5.051
-0.024
-0.48%
1 ene 1985 año
4.877
-0.174
-3.44%
1 ene 1986 año
4.779
-0.098
-2.01%
1 ene 1987 año
5.043
+0.264
5.53%
1 ene 1988 año
5.243
+0.2
3.97%
1 ene 1989 año
5.464
+0.221
4.22%
1 ene 1990 año
5.695
+0.231
4.22%
1 ene 1991 año
5.969
+0.274
4.81%
1 ene 1992 año
6.151
+0.182
3.04%
1 ene 1993 año
6.349
+0.198
3.23%
1 ene 1994 año
6.396
+0.047
0.74%
1 ene 1995 año
6.375
-0.021
-0.34%
1 ene 1996 año
6.337
-0.038
-0.59%
1 ene 1997 año
6.183
-0.154
-2.43%
1 ene 1998 año
6.325
+0.142
2.3%
1 ene 2000 año
7.038
+0.713
11.27%
1 ene 2001 año
7.387
+0.348
4.95%
1 ene 2002 año
7.741
+0.354
4.8%
1 ene 2003 año
7.945
+0.204
2.64%
1 ene 2004 año
8.015
+0.07
0.88%
1 ene 2005 año
8.071
+0.056
0.7%
1 ene 2006 año
8.047
-0.024
-0.3%
1 ene 2007 año
8.072
+0.025
0.31%
1 ene 2008 año
8.107
+0.035
0.44%
1 ene 2009 año
8.232
+0.125
1.54%
1 ene 2010 año
8.28
+0.048
0.59%
1 ene 2011 año
8.235
-0.045
-0.55%
1 ene 2012 año
8.259
+0.024
0.29%
1 ene 2013 año
8.346
+0.087
1.06%
1 ene 2014 año
8.523
+0.177
2.12%
1 ene 2015 año
8.731
+0.209
2.45%
Ranking de los países por los datos estadísticos actuales


Comentarios: