29
/es/
es
AIzaSyAYiBZKx7MnpbEhh9jyipgxe19OcubqV5w
April 1, 2024
31020
Europe & Central Asia
ECS
false
2
1
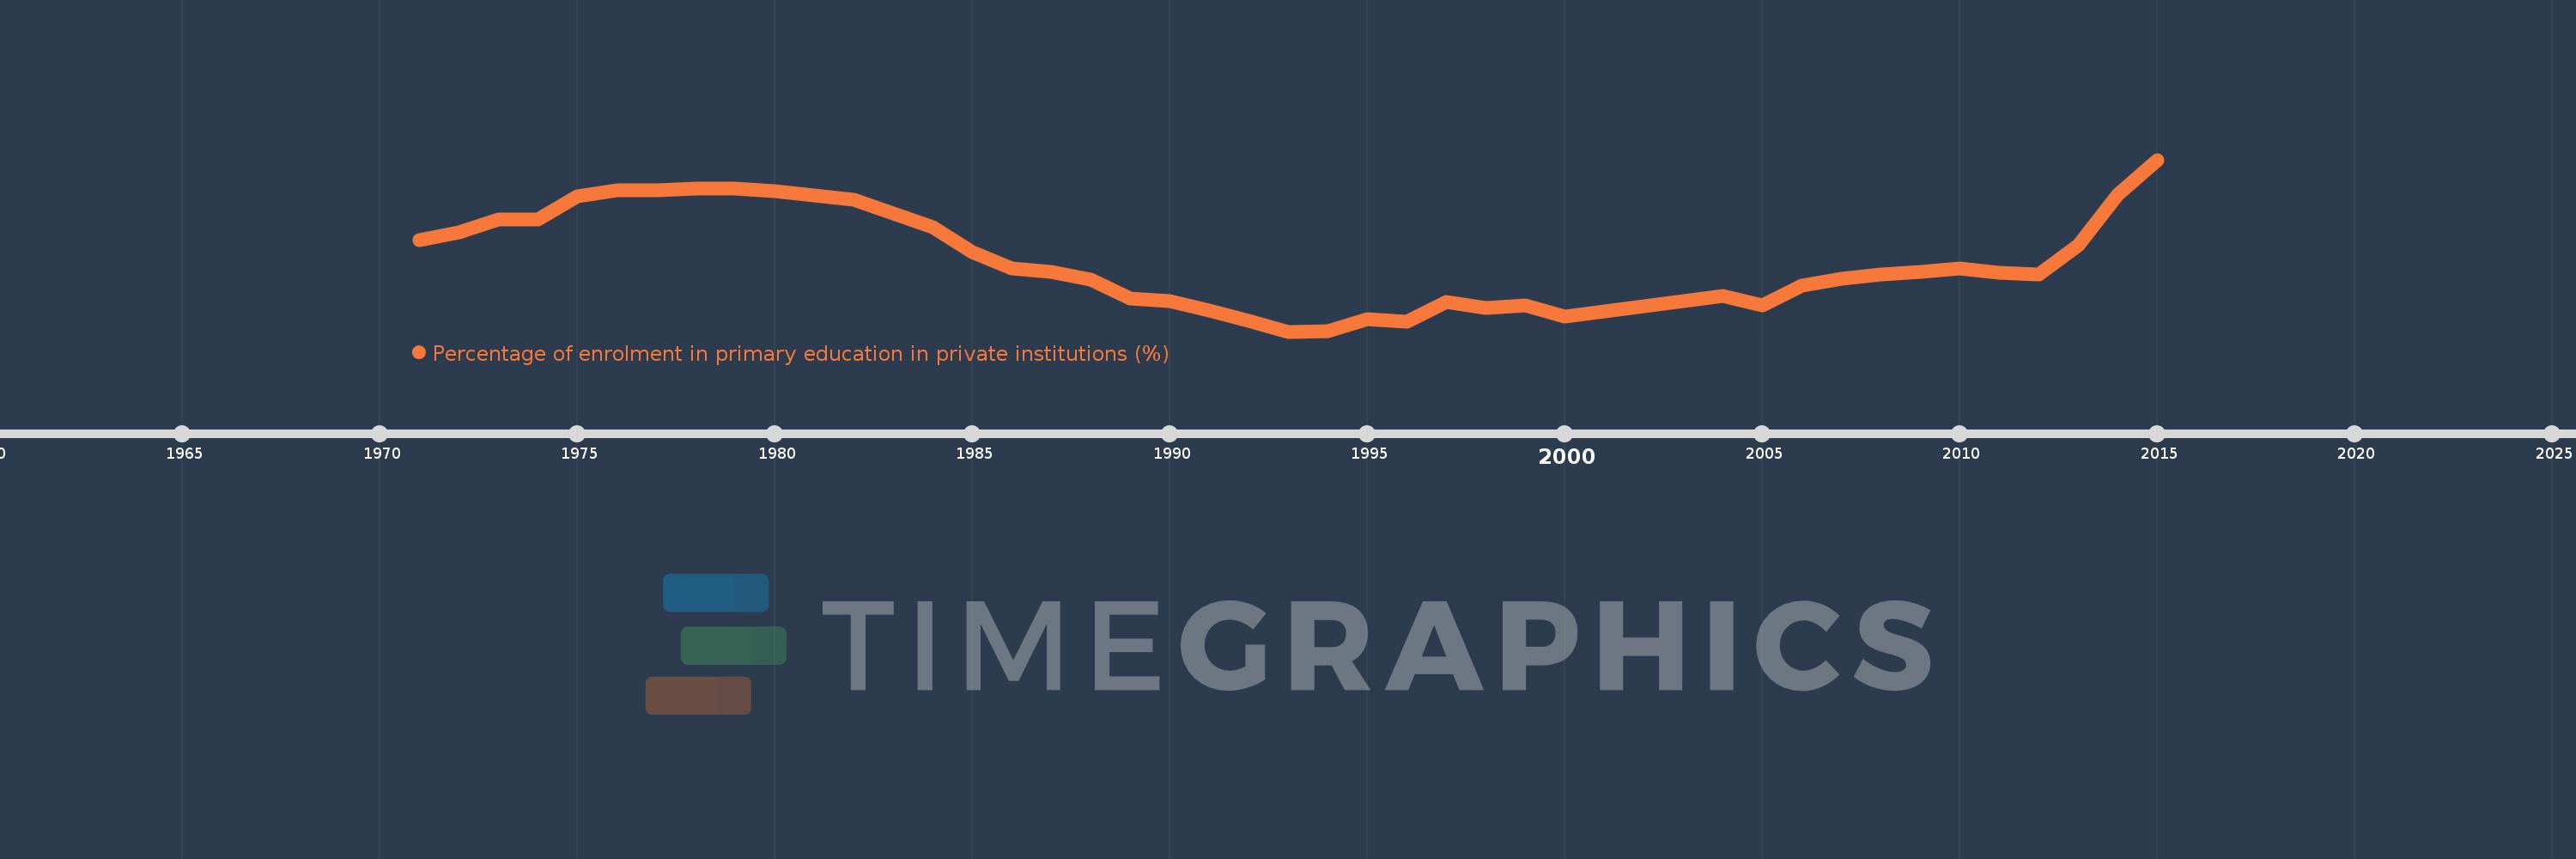
Percentage of enrolment in primary education in private institutions (%)
2015,2014,2013,2012,2011,2010,2009,2008,2007,2006,2005,2004,2003,2002,2001,2000,1999,1998,1997,1996,1995,1994,1993,1992,1991,1990,1989,1988,1987,1986,1985,1984,1983,1982,1981,1980,1979,1978,1977,1976,1975,1974,1973,1972,1971
Estas estadísticas en otros países:
AfghanistanAlbaniaAlgeriaAndorraAngolaAntigua and BarbudaArab WorldArgentinaArmeniaArubaAustraliaAustriaAzerbaijanBahamas, TheBahrainBangladeshBarbadosBelarusBelgiumBelizeBeninBermudaBhutanBoliviaBosnia and HerzegovinaBotswanaBrazilBritish Virgin IslandsBrunei DarussalamBulgariaBurkina FasoBurundiCabo VerdeCambodiaCameroonCanadaCaribbean small statesCayman IslandsCentral African RepublicCentral Europe and the BalticsChadChileChinaColombiaComorosCongo, Dem. Rep.Congo, Rep.Costa RicaCote d'IvoireCroatiaCubaCuracaoCyprusCzech RepublicDenmarkDjiboutiDominicaDominican RepublicEarly-demographic dividendEast Asia & PacificEast Asia & Pacific (excluding high income)East Asia & Pacific (IDA & IBRD countries)EcuadorEgypt, Arab Rep.El SalvadorEquatorial GuineaEritreaEstoniaEthiopiaEuro areaEurope & Central AsiaEurope & Central Asia (excluding high income)Europe & Central Asia (IDA & IBRD countries)European UnionFijiFinlandFragile and conflict affected situationsFranceGabonGambia, TheGeorgiaGermanyGhanaGibraltarGreeceGrenadaGuatemalaGuineaGuinea-BissauGuyanaHaitiHeavily indebted poor countries (HIPC)High incomeHondurasHong Kong SAR, ChinaHungaryIBRD onlyIcelandIDA & IBRD totalIDA blendIDA onlyIDA totalIndiaIndonesiaIran, Islamic Rep.IraqIrelandIsraelItalyJamaicaJapanJordanKazakhstanKenyaKiribatiKorea, Rep.KuwaitKyrgyz RepublicLao PDRLate-demographic dividendLatin America & Caribbean Latin America & Caribbean (excluding high income)Latin America & the Caribbean (IDA & IBRD countries)LatviaLeast developed countries: UN classificationLebanonLesothoLiberiaLibyaLiechtensteinLithuaniaLow & middle incomeLow incomeLower middle incomeLuxembourgMacao SAR, ChinaMacedonia, FYRMadagascarMalawiMalaysiaMaldivesMaliMaltaMarshall IslandsMauritaniaMauritiusMexicoMiddle East & North AfricaMiddle East & North Africa (excluding high income)Middle East & North Africa (IDA & IBRD countries)Middle incomeMoldovaMonacoMongoliaMoroccoMozambiqueMyanmarNamibiaNauruNepalNetherlandsNew ZealandNicaraguaNigerNigeriaNorth AmericaNorwayOECD membersOmanOther small statesPacific island small statesPakistanPalauPanamaPapua New GuineaParaguayPeruPhilippinesPolandPortugalPost-demographic dividendPre-demographic dividendPuerto RicoQatarRomaniaRussian FederationRwandaSamoaSan MarinoSao Tome and PrincipeSaudi ArabiaSenegalSerbiaSeychellesSierra LeoneSingaporeSlovak RepublicSloveniaSmall statesSolomon IslandsSomaliaSouth AfricaSouth AsiaSouth Asia (IDA & IBRD)SpainSri LankaSt. Kitts and NevisSt. LuciaSt. Vincent and the GrenadinesSub-Saharan Africa Sub-Saharan Africa (excluding high income)Sub-Saharan Africa (IDA & IBRD countries)SudanSurinameSwazilandSwedenSwitzerlandSyrian Arab RepublicTajikistanTanzaniaThailandTimor-LesteTogoTongaTrinidad and TobagoTunisiaTurkeyTurks and Caicos IslandsTuvaluUgandaUkraineUnited Arab EmiratesUnited KingdomUnited StatesUpper middle incomeUruguayVanuatuVenezuela, RBVietnamWest Bank and GazaWorldYemen, Rep.ZambiaZimbabwe línea de tiempo (timeline):
En esta escala de tiempo se presenta un gráfico de 1971 y 2015 de Europe & Central Asia. Los datos de 1970 están ausentes. El número de observaciones reales por fecha: 45.
Fuente (nombre):
Indicadores del desarrollo mundial
Fuente (organización):
UNESCO Institute for Statistics
Categorías:
Education
Se ha actualizado:
23 abr 2017 año
Los indicadores de los cambios de valor en los últimos años
Mínimo:
6.054
1 ene 1993 año
Máximo:
7.665
1 ene 2015 año
A la fecha de observación
Valor
Cambio absoluto
El cambio con respecto al valor anterior
1 ene 1971 año
6.91
+6.91
0.0%
1 ene 1972 año
6.983
+0.073
1.05%
1 ene 1973 año
7.102
+0.119
1.7%
1 ene 1974 año
7.103
+0.002
0.02%
1 ene 1975 año
7.324
+0.22
3.1%
1 ene 1976 año
7.38
+0.056
0.77%
1 ene 1977 año
7.377
-0.004
-0.05%
1 ene 1978 año
7.392
+0.016
0.22%
1 ene 1979 año
7.396
+0.004
0.05%
1 ene 1980 año
7.368
-0.029
-0.39%
1 ene 1981 año
7.334
-0.033
-0.45%
1 ene 1982 año
7.293
-0.041
-0.56%
1 ene 1983 año
7.159
-0.134
-1.84%
1 ene 1984 año
7.034
-0.125
-1.75%
1 ene 1985 año
6.798
-0.236
-3.36%
1 ene 1986 año
6.646
-0.152
-2.24%
1 ene 1987 año
6.612
-0.034
-0.51%
1 ene 1988 año
6.544
-0.067
-1.02%
1 ene 1989 año
6.366
-0.178
-2.72%
1 ene 1990 año
6.338
-0.028
-0.44%
1 ene 1991 año
6.248
-0.09
-1.41%
1 ene 1992 año
6.151
-0.098
-1.56%
1 ene 1993 año
6.054
-0.097
-1.58%
1 ene 1994 año
6.061
+0.008
0.12%
1 ene 1995 año
6.171
+0.11
1.82%
1 ene 1996 año
6.145
-0.026
-0.43%
1 ene 1997 año
6.328
+0.182
2.97%
1 ene 1998 año
6.273
-0.055
-0.87%
1 ene 1999 año
6.3
+0.027
0.44%
1 ene 2000 año
6.194
-0.106
-1.68%
1 ene 2001 año
6.24
+0.045
0.73%
1 ene 2002 año
6.289
+0.049
0.79%
1 ene 2003 año
6.338
+0.049
0.78%
1 ene 2004 año
6.386
+0.048
0.76%
1 ene 2005 año
6.302
-0.085
-1.33%
1 ene 2006 año
6.485
+0.183
2.91%
1 ene 2007 año
6.546
+0.061
0.95%
1 ene 2008 año
6.588
+0.042
0.64%
1 ene 2009 año
6.615
+0.027
0.41%
1 ene 2010 año
6.647
+0.032
0.49%
1 ene 2011 año
6.603
-0.045
-0.67%
1 ene 2012 año
6.587
-0.016
-0.24%
1 ene 2013 año
6.864
+0.277
4.21%
1 ene 2014 año
7.336
+0.472
6.87%
1 ene 2015 año
7.665
+0.329
4.48%
Ranking de los países por los datos estadísticos actuales


Comentarios: