29
/es/
es
AIzaSyAYiBZKx7MnpbEhh9jyipgxe19OcubqV5w
April 1, 2024
256702
Sweden
SWE
true
2
1
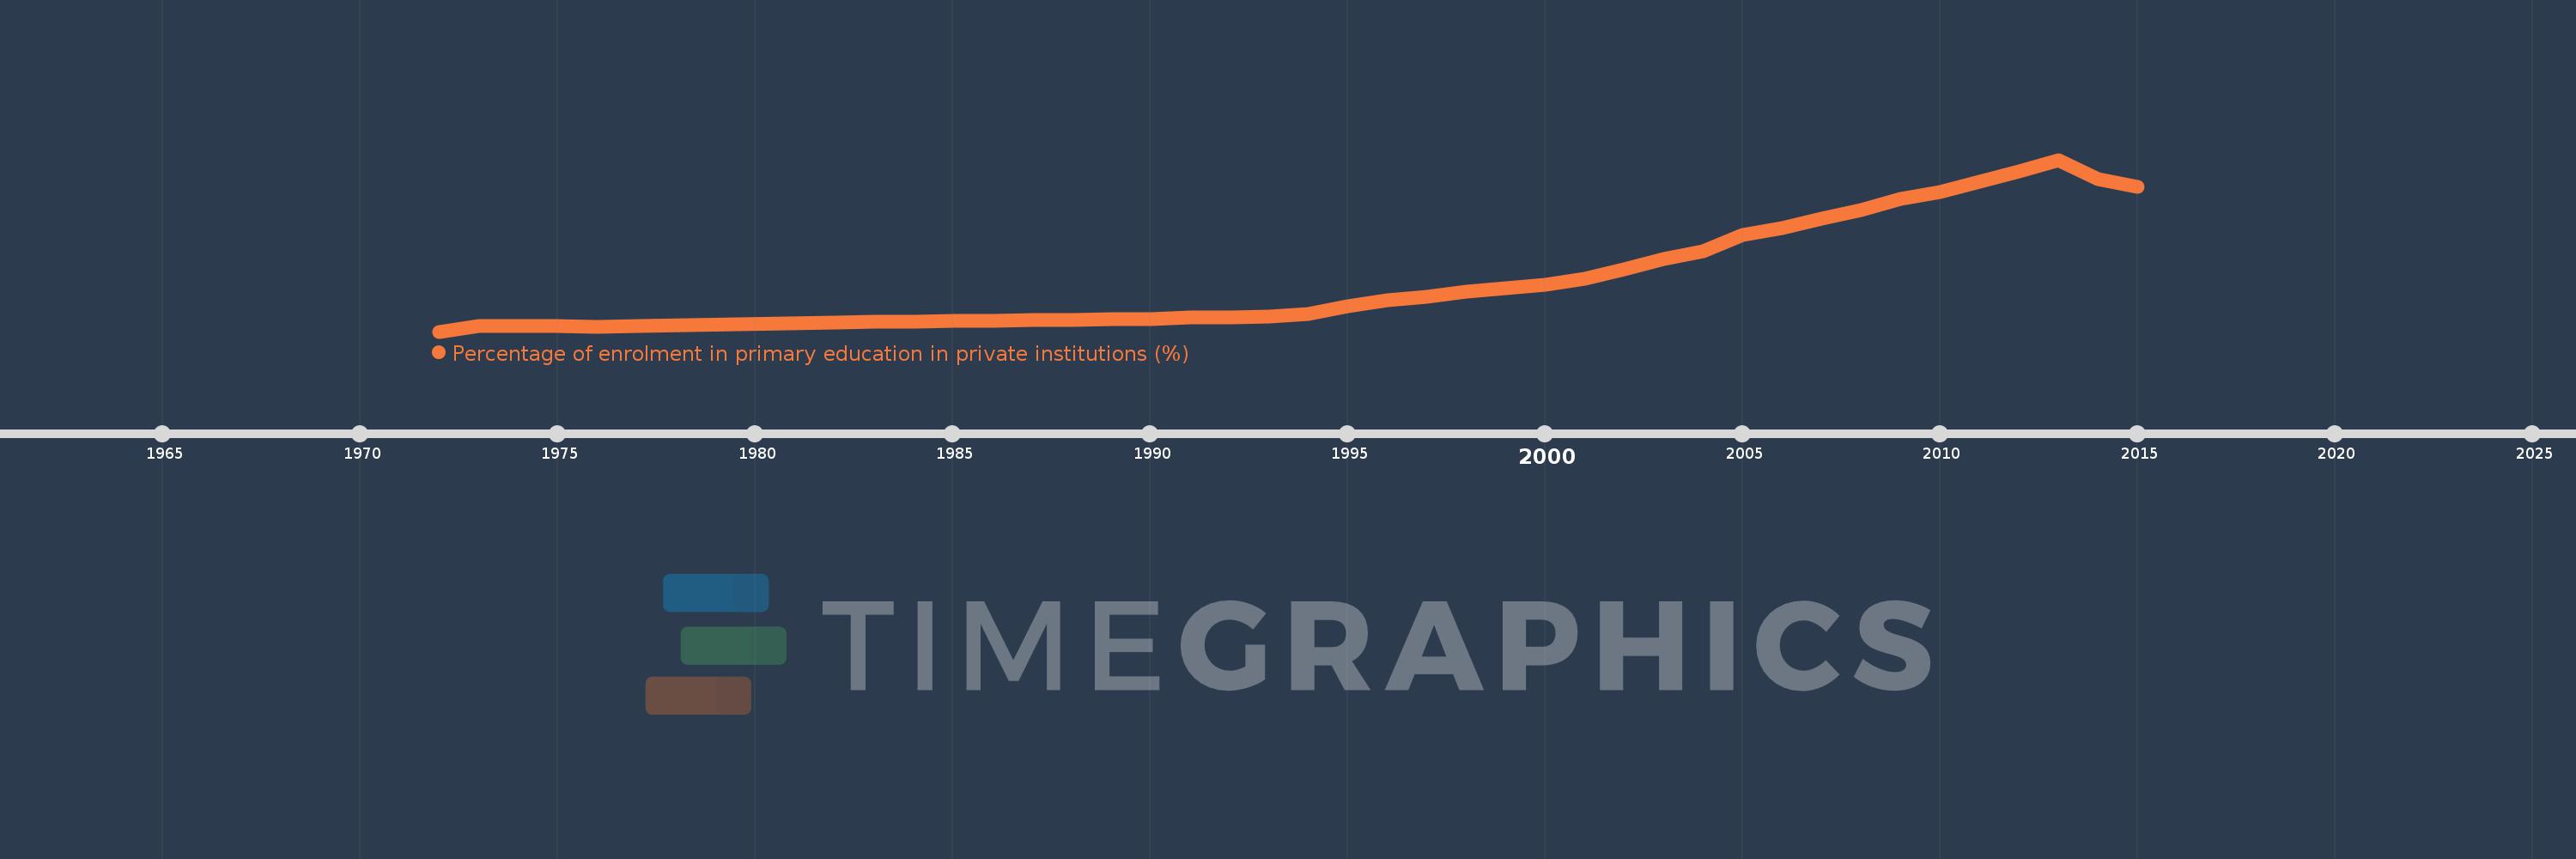
Percentage of enrolment in primary education in private institutions (%)
2015,2014,2013,2012,2011,2010,2009,2008,2007,2006,2005,2004,2003,2002,2001,2000,1998,1997,1996,1995,1994,1993,1992,1991,1990,1989,1988,1987,1986,1985,1984,1983,1982,1977,1976,1975,1974,1973,1972
Estas estadísticas en otros países:
AfghanistanAlbaniaAlgeriaAndorraAngolaAntigua and BarbudaArab WorldArgentinaArmeniaArubaAustraliaAustriaAzerbaijanBahamas, TheBahrainBangladeshBarbadosBelarusBelgiumBelizeBeninBermudaBhutanBoliviaBosnia and HerzegovinaBotswanaBrazilBritish Virgin IslandsBrunei DarussalamBulgariaBurkina FasoBurundiCabo VerdeCambodiaCameroonCanadaCaribbean small statesCayman IslandsCentral African RepublicCentral Europe and the BalticsChadChileChinaColombiaComorosCongo, Dem. Rep.Congo, Rep.Costa RicaCote d'IvoireCroatiaCubaCuracaoCyprusCzech RepublicDenmarkDjiboutiDominicaDominican RepublicEarly-demographic dividendEast Asia & PacificEast Asia & Pacific (excluding high income)East Asia & Pacific (IDA & IBRD countries)EcuadorEgypt, Arab Rep.El SalvadorEquatorial GuineaEritreaEstoniaEthiopiaEuro areaEurope & Central AsiaEurope & Central Asia (excluding high income)Europe & Central Asia (IDA & IBRD countries)European UnionFijiFinlandFragile and conflict affected situationsFranceGabonGambia, TheGeorgiaGermanyGhanaGibraltarGreeceGrenadaGuatemalaGuineaGuinea-BissauGuyanaHaitiHeavily indebted poor countries (HIPC)High incomeHondurasHong Kong SAR, ChinaHungaryIBRD onlyIcelandIDA & IBRD totalIDA blendIDA onlyIDA totalIndiaIndonesiaIran, Islamic Rep.IraqIrelandIsraelItalyJamaicaJapanJordanKazakhstanKenyaKiribatiKorea, Rep.KuwaitKyrgyz RepublicLao PDRLate-demographic dividendLatin America & Caribbean Latin America & Caribbean (excluding high income)Latin America & the Caribbean (IDA & IBRD countries)LatviaLeast developed countries: UN classificationLebanonLesothoLiberiaLibyaLiechtensteinLithuaniaLow & middle incomeLow incomeLower middle incomeLuxembourgMacao SAR, ChinaMacedonia, FYRMadagascarMalawiMalaysiaMaldivesMaliMaltaMarshall IslandsMauritaniaMauritiusMexicoMiddle East & North AfricaMiddle East & North Africa (excluding high income)Middle East & North Africa (IDA & IBRD countries)Middle incomeMoldovaMonacoMongoliaMoroccoMozambiqueMyanmarNamibiaNauruNepalNetherlandsNew ZealandNicaraguaNigerNigeriaNorth AmericaNorwayOECD membersOmanOther small statesPacific island small statesPakistanPalauPanamaPapua New GuineaParaguayPeruPhilippinesPolandPortugalPost-demographic dividendPre-demographic dividendPuerto RicoQatarRomaniaRussian FederationRwandaSamoaSan MarinoSao Tome and PrincipeSaudi ArabiaSenegalSerbiaSeychellesSierra LeoneSingaporeSlovak RepublicSloveniaSmall statesSolomon IslandsSomaliaSouth AfricaSouth AsiaSouth Asia (IDA & IBRD)SpainSri LankaSt. Kitts and NevisSt. LuciaSt. Vincent and the GrenadinesSub-Saharan Africa Sub-Saharan Africa (excluding high income)Sub-Saharan Africa (IDA & IBRD countries)SudanSurinameSwazilandSwedenSwitzerlandSyrian Arab RepublicTajikistanTanzaniaThailandTimor-LesteTogoTongaTrinidad and TobagoTunisiaTurkeyTurks and Caicos IslandsTuvaluUgandaUkraineUnited Arab EmiratesUnited KingdomUnited StatesUpper middle incomeUruguayVanuatuVenezuela, RBVietnamWest Bank and GazaWorldYemen, Rep.ZambiaZimbabwe línea de tiempo (timeline):
En esta escala de tiempo se presenta un gráfico de 1972 y 2015 de Sweden. Los datos de 1971 están ausentes. El número de observaciones reales por fecha: 39.
Fuente (nombre):
Indicadores del desarrollo mundial
Fuente (organización):
UNESCO Institute for Statistics
Categorías:
Education
Se ha actualizado:
23 abr 2017 año
Los indicadores de los cambios de valor en los últimos años
Máximo:
10.889
1 ene 2013 año
A la fecha de observación
Valor
Cambio absoluto
El cambio con respecto al valor anterior
1 ene 1972 año
0.0
0.0
0.0%
1 ene 1973 año
0.369
+0.369
%
1 ene 1974 año
0.373
+0.004
1.03%
1 ene 1975 año
0.328
-0.046
-12.22%
1 ene 1976 año
0.314
-0.014
-4.13%
1 ene 1977 año
0.38
+0.066
20.92%
1 ene 1982 año
0.587
+0.207
54.53%
1 ene 1983 año
0.619
+0.032
5.5%
1 ene 1984 año
0.645
+0.025
4.11%
1 ene 1985 año
0.686
+0.041
6.42%
1 ene 1986 año
0.703
+0.017
2.5%
1 ene 1987 año
0.739
+0.036
5.06%
1 ene 1988 año
0.748
+0.009
1.19%
1 ene 1989 año
0.791
+0.043
5.75%
1 ene 1990 año
0.808
+0.018
2.25%
1 ene 1991 año
0.882
+0.073
9.05%
1 ene 1992 año
0.914
+0.032
3.68%
1 ene 1993 año
0.976
+0.062
6.81%
1 ene 1994 año
1.128
+0.152
15.56%
1 ene 1995 año
1.589
+0.461
40.83%
1 ene 1996 año
1.99
+0.401
25.25%
1 ene 1997 año
2.188
+0.198
9.94%
1 ene 1998 año
2.51
+0.323
14.75%
1 ene 2000 año
2.979
+0.469
18.67%
1 ene 2001 año
3.36
+0.381
12.78%
1 ene 2002 año
3.933
+0.574
17.07%
1 ene 2003 año
4.612
+0.678
17.25%
1 ene 2004 año
5.096
+0.484
10.5%
1 ene 2005 año
6.118
+1.022
20.05%
1 ene 2006 año
6.578
+0.459
7.51%
1 ene 2007 año
7.151
+0.573
8.71%
1 ene 2008 año
7.715
+0.564
7.89%
1 ene 2009 año
8.387
+0.672
8.71%
1 ene 2010 año
8.842
+0.456
5.43%
1 ene 2011 año
9.49
+0.648
7.33%
1 ene 2012 año
10.147
+0.657
6.92%
1 ene 2013 año
10.889
+0.742
7.31%
1 ene 2014 año
9.69
-1.199
-11.01%
1 ene 2015 año
9.187
-0.503
-5.19%
Ranking de los países por los datos estadísticos actuales


Comentarios: