29
/es/
es
AIzaSyAYiBZKx7MnpbEhh9jyipgxe19OcubqV5w
April 1, 2024
85566
Bhutan
BTN
true
2
1
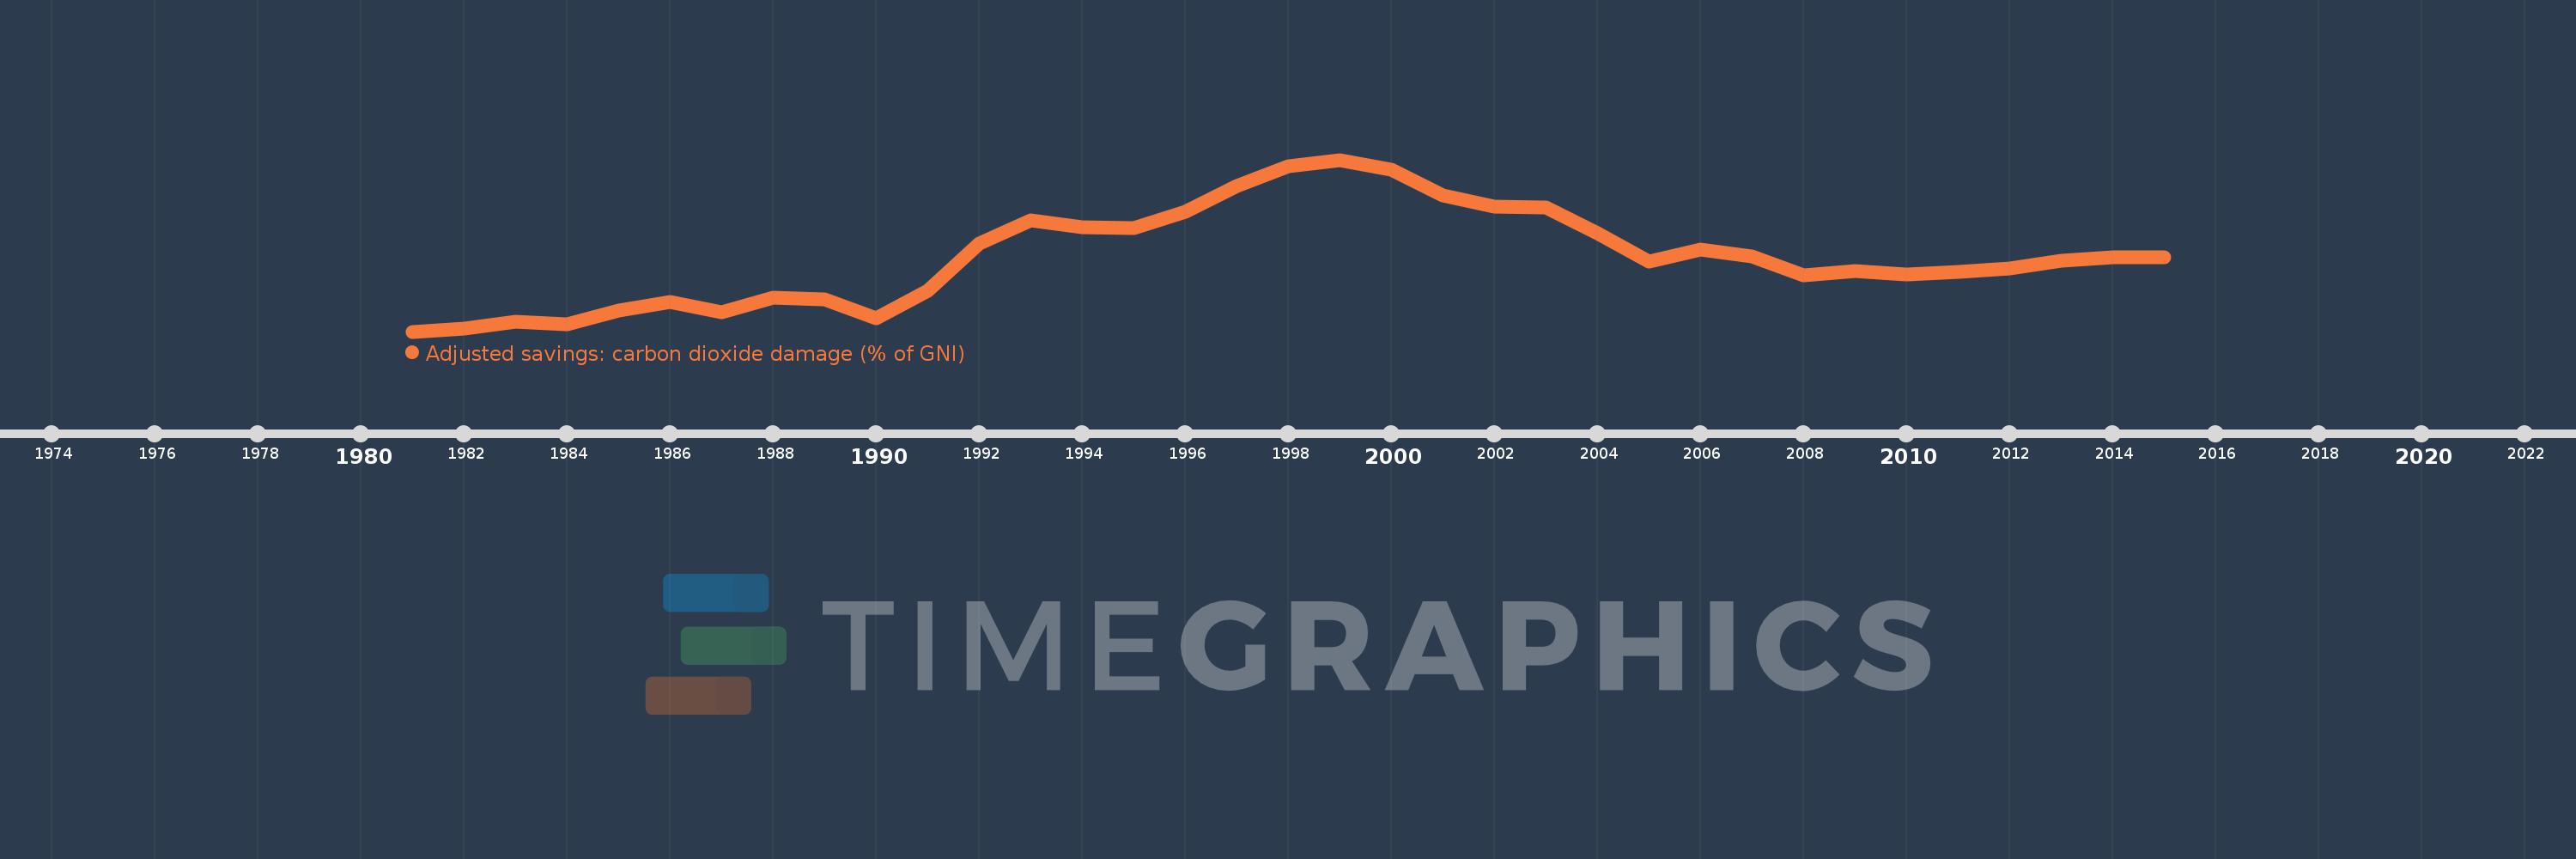
Adjusted savings: carbon dioxide damage (% of GNI)
2015,2014,2013,2012,2011,2010,2009,2008,2007,2006,2005,2004,2003,2002,2001,2000,1999,1998,1997,1996,1995,1994,1993,1992,1991,1990,1989,1988,1987,1986,1985,1984,1983,1982,1981
Estas estadísticas en otros países:
AfghanistanAlbaniaAlgeriaAndorraAngolaAntigua and BarbudaArab WorldArgentinaArmeniaAustraliaAustriaAzerbaijanBahamas, TheBahrainBangladeshBarbadosBelarusBelgiumBelizeBeninBermudaBhutanBoliviaBosnia and HerzegovinaBotswanaBrazilBrunei DarussalamBulgariaBurkina FasoBurundiCabo VerdeCambodiaCameroonCanadaCaribbean small statesCentral African RepublicCentral Europe and the BalticsChadChileChinaColombiaComorosCongo, Dem. Rep.Congo, Rep.Costa RicaCote d'IvoireCroatiaCubaCyprusCzech RepublicDenmarkDjiboutiDominicaDominican RepublicEarly-demographic dividendEast Asia & PacificEast Asia & Pacific (excluding high income)East Asia & Pacific (IDA & IBRD countries)EcuadorEgypt, Arab Rep.El SalvadorEquatorial GuineaEritreaEstoniaEthiopiaEuro areaEurope & Central AsiaEurope & Central Asia (excluding high income)Europe & Central Asia (IDA & IBRD countries)European UnionFaroe IslandsFijiFinlandFragile and conflict affected situationsFranceFrench PolynesiaGabonGambia, TheGeorgiaGermanyGhanaGreeceGreenlandGrenadaGuatemalaGuineaGuinea-BissauGuyanaHaitiHeavily indebted poor countries (HIPC)High incomeHondurasHong Kong SAR, ChinaHungaryIBRD onlyIcelandIDA & IBRD totalIDA blendIDA onlyIDA totalIndiaIndonesiaIran, Islamic Rep.IraqIrelandIsraelItalyJamaicaJapanJordanKazakhstanKenyaKiribatiKorea, Rep.KuwaitKyrgyz RepublicLao PDRLate-demographic dividendLatin America & Caribbean Latin America & Caribbean (excluding high income)Latin America & the Caribbean (IDA & IBRD countries)LatviaLeast developed countries: UN classificationLebanonLesothoLiberiaLibyaLiechtensteinLithuaniaLow & middle incomeLow incomeLower middle incomeLuxembourgMacao SAR, ChinaMacedonia, FYRMadagascarMalawiMalaysiaMaldivesMaliMaltaMarshall IslandsMauritaniaMauritiusMexicoMicronesia, Fed. Sts.Middle East & North AfricaMiddle East & North Africa (excluding high income)Middle East & North Africa (IDA & IBRD countries)Middle incomeMoldovaMongoliaMontenegroMoroccoMozambiqueNamibiaNepalNetherlandsNew CaledoniaNew ZealandNicaraguaNigerNigeriaNorth AmericaNorwayOECD membersOmanOther small statesPacific island small statesPakistanPalauPanamaPapua New GuineaParaguayPeruPhilippinesPolandPortugalPost-demographic dividendPre-demographic dividendQatarRomaniaRussian FederationRwandaSamoaSao Tome and PrincipeSaudi ArabiaSenegalSerbiaSeychellesSierra LeoneSingaporeSlovak RepublicSloveniaSmall statesSolomon IslandsSouth AfricaSouth AsiaSouth Asia (IDA & IBRD)SpainSri LankaSt. Kitts and NevisSt. LuciaSt. Vincent and the GrenadinesSub-Saharan Africa Sub-Saharan Africa (excluding high income)Sub-Saharan Africa (IDA & IBRD countries)SudanSurinameSwazilandSwedenSwitzerlandSyrian Arab RepublicTajikistanTanzaniaThailandTimor-LesteTogoTongaTrinidad and TobagoTunisiaTurkeyTurkmenistanUgandaUkraineUnited Arab EmiratesUnited KingdomUnited StatesUpper middle incomeUruguayUzbekistanVanuatuVenezuela, RBVietnamWest Bank and GazaWorldYemen, Rep.ZambiaZimbabwe línea de tiempo (timeline):
En esta escala de tiempo se presenta un gráfico de 1981 y 2015 de Bhutan. Los datos de 1980 están ausentes. El número de observaciones reales por fecha: 35.
Fuente (nombre):
Indicadores del desarrollo mundial
Fuente (organización):
World Bank staff estimates based on Samuel Fankhauser's "Valuing Climate Change: The Economics of the Greenhouse" (1995).
Categorías:
Economy & Growth, Environment
Se ha actualizado:
23 abr 2017 año
Los indicadores de los cambios de valor en los últimos años
Mínimo:
0.058
1 ene 1981 año
Máximo:
0.769
1 ene 1999 año
A la fecha de observación
Valor
Cambio absoluto
El cambio con respecto al valor anterior
1 ene 1981 año
0.058
+0.058
0.0%
1 ene 1982 año
0.072
+0.014
23.41%
1 ene 1983 año
0.1
+0.028
38.52%
1 ene 1984 año
0.089
-0.011
-10.78%
1 ene 1985 año
0.145
+0.056
63.39%
1 ene 1986 año
0.181
+0.036
24.47%
1 ene 1987 año
0.137
-0.044
-24.26%
1 ene 1988 año
0.198
+0.061
44.49%
1 ene 1989 año
0.191
-0.007
-3.38%
1 ene 1990 año
0.112
-0.08
-41.63%
1 ene 1991 año
0.226
+0.114
101.96%
1 ene 1992 año
0.423
+0.197
87.49%
1 ene 1993 año
0.52
+0.097
22.93%
1 ene 1994 año
0.49
-0.029
-5.66%
1 ene 1995 año
0.486
-0.005
-0.98%
1 ene 1996 año
0.554
+0.069
14.16%
1 ene 1997 año
0.659
+0.105
18.85%
1 ene 1998 año
0.742
+0.083
12.57%
1 ene 1999 año
0.769
+0.028
3.74%
1 ene 2000 año
0.729
-0.04
-5.2%
1 ene 2001 año
0.621
-0.109
-14.92%
1 ene 2002 año
0.575
-0.045
-7.29%
1 ene 2003 año
0.572
-0.003
-0.56%
1 ene 2004 año
0.464
-0.108
-18.91%
1 ene 2005 año
0.348
-0.116
-24.91%
1 ene 2006 año
0.398
+0.049
14.13%
1 ene 2007 año
0.37
-0.027
-6.83%
1 ene 2008 año
0.291
-0.079
-21.4%
1 ene 2009 año
0.31
+0.019
6.61%
1 ene 2010 año
0.294
-0.016
-5.25%
1 ene 2011 año
0.306
+0.012
4.06%
1 ene 2012 año
0.319
+0.013
4.13%
1 ene 2013 año
0.35
+0.031
9.67%
1 ene 2014 año
0.366
+0.016
4.7%
1 ene 2015 año
0.365
-0.001
-0.26%
Ranking de los países por los datos estadísticos actuales


Comentarios: