29
/es/
es
AIzaSyAYiBZKx7MnpbEhh9jyipgxe19OcubqV5w
April 1, 2024
53185
Other small states
OSS
false
2
1
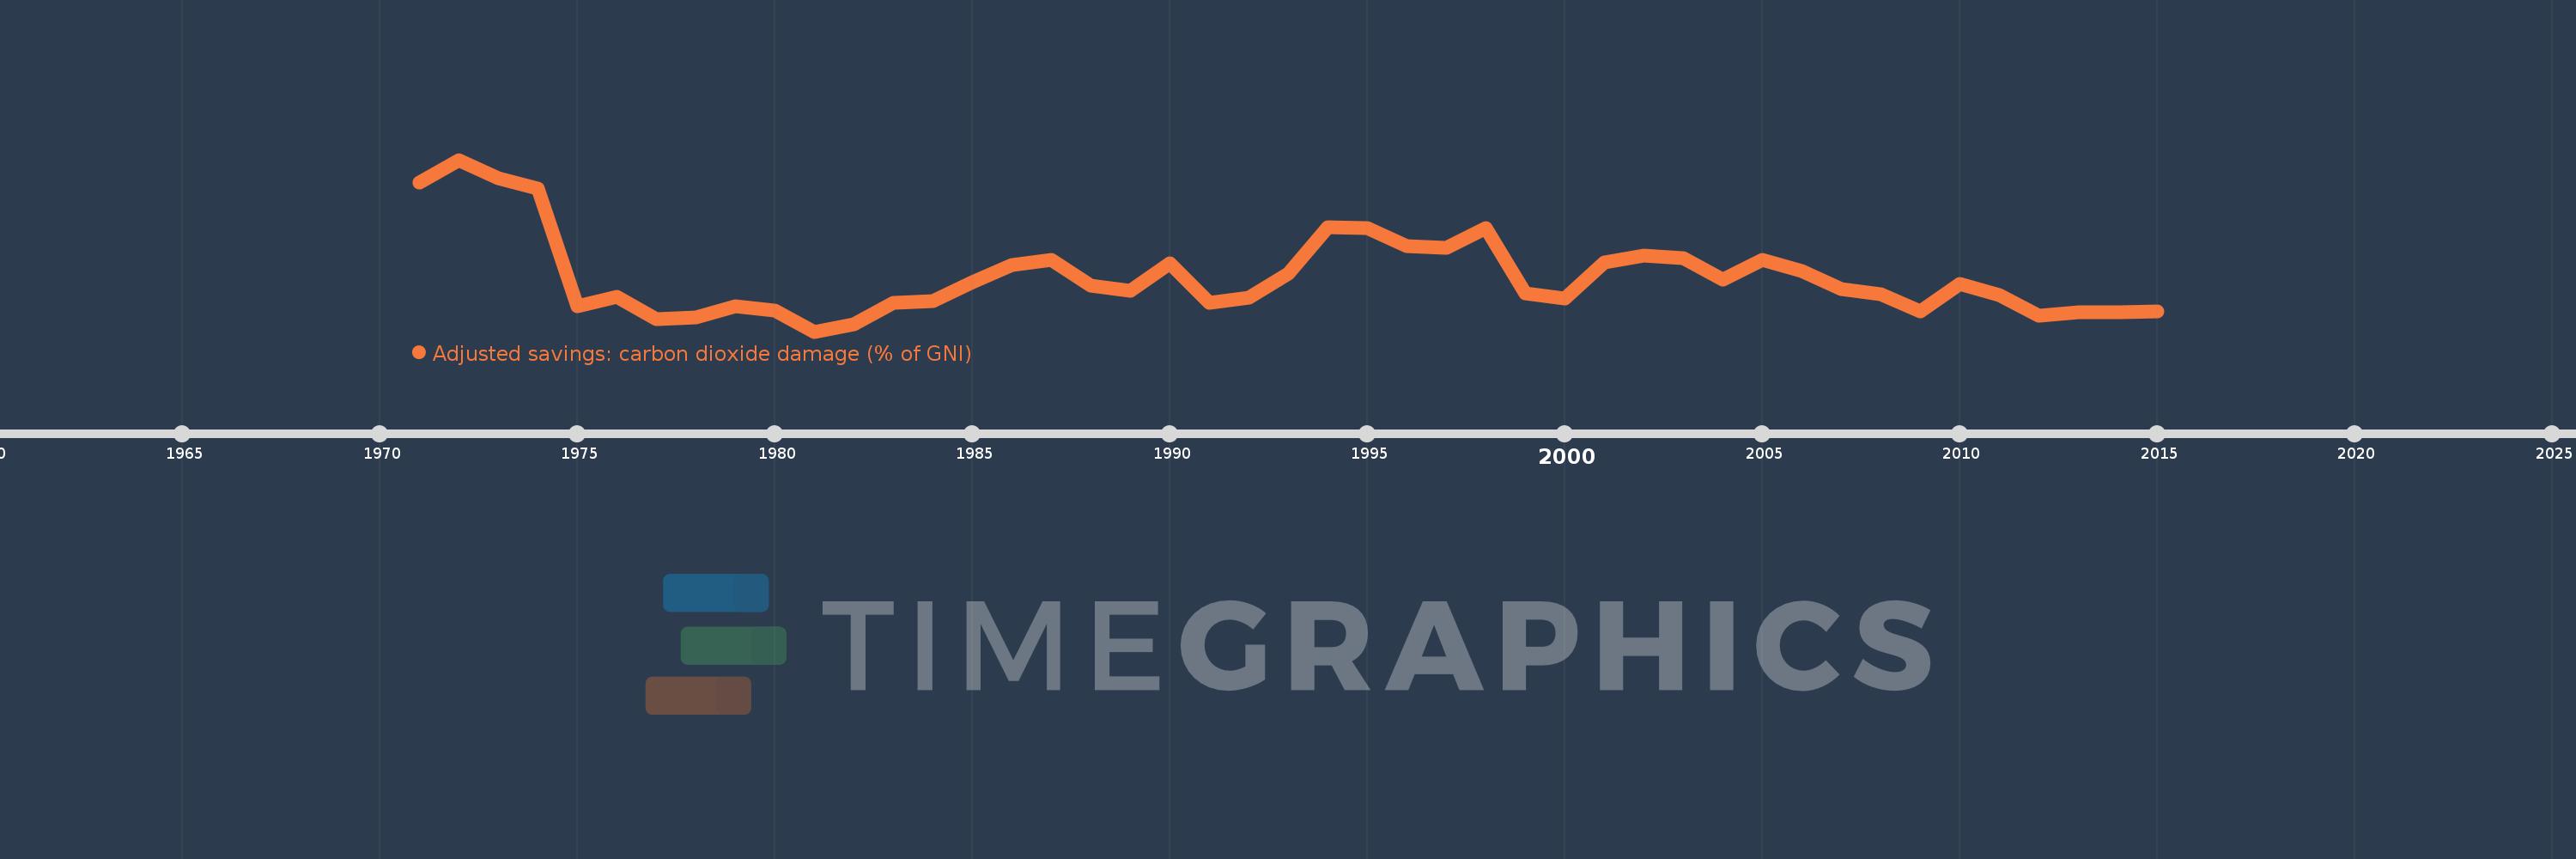
Adjusted savings: carbon dioxide damage (% of GNI)
2015,2014,2013,2012,2011,2010,2009,2008,2007,2006,2005,2004,2003,2002,2001,2000,1999,1998,1997,1996,1995,1994,1993,1992,1991,1990,1989,1988,1987,1986,1985,1984,1983,1982,1981,1980,1979,1978,1977,1976,1975,1974,1973,1972,1971
Estas estadísticas en otros países:
AfghanistanAlbaniaAlgeriaAndorraAngolaAntigua and BarbudaArab WorldArgentinaArmeniaAustraliaAustriaAzerbaijanBahamas, TheBahrainBangladeshBarbadosBelarusBelgiumBelizeBeninBermudaBhutanBoliviaBosnia and HerzegovinaBotswanaBrazilBrunei DarussalamBulgariaBurkina FasoBurundiCabo VerdeCambodiaCameroonCanadaCaribbean small statesCentral African RepublicCentral Europe and the BalticsChadChileChinaColombiaComorosCongo, Dem. Rep.Congo, Rep.Costa RicaCote d'IvoireCroatiaCubaCyprusCzech RepublicDenmarkDjiboutiDominicaDominican RepublicEarly-demographic dividendEast Asia & PacificEast Asia & Pacific (excluding high income)East Asia & Pacific (IDA & IBRD countries)EcuadorEgypt, Arab Rep.El SalvadorEquatorial GuineaEritreaEstoniaEthiopiaEuro areaEurope & Central AsiaEurope & Central Asia (excluding high income)Europe & Central Asia (IDA & IBRD countries)European UnionFaroe IslandsFijiFinlandFragile and conflict affected situationsFranceFrench PolynesiaGabonGambia, TheGeorgiaGermanyGhanaGreeceGreenlandGrenadaGuatemalaGuineaGuinea-BissauGuyanaHaitiHeavily indebted poor countries (HIPC)High incomeHondurasHong Kong SAR, ChinaHungaryIBRD onlyIcelandIDA & IBRD totalIDA blendIDA onlyIDA totalIndiaIndonesiaIran, Islamic Rep.IraqIrelandIsraelItalyJamaicaJapanJordanKazakhstanKenyaKiribatiKorea, Rep.KuwaitKyrgyz RepublicLao PDRLate-demographic dividendLatin America & Caribbean Latin America & Caribbean (excluding high income)Latin America & the Caribbean (IDA & IBRD countries)LatviaLeast developed countries: UN classificationLebanonLesothoLiberiaLibyaLiechtensteinLithuaniaLow & middle incomeLow incomeLower middle incomeLuxembourgMacao SAR, ChinaMacedonia, FYRMadagascarMalawiMalaysiaMaldivesMaliMaltaMarshall IslandsMauritaniaMauritiusMexicoMicronesia, Fed. Sts.Middle East & North AfricaMiddle East & North Africa (excluding high income)Middle East & North Africa (IDA & IBRD countries)Middle incomeMoldovaMongoliaMontenegroMoroccoMozambiqueNamibiaNepalNetherlandsNew CaledoniaNew ZealandNicaraguaNigerNigeriaNorth AmericaNorwayOECD membersOmanOther small statesPacific island small statesPakistanPalauPanamaPapua New GuineaParaguayPeruPhilippinesPolandPortugalPost-demographic dividendPre-demographic dividendQatarRomaniaRussian FederationRwandaSamoaSao Tome and PrincipeSaudi ArabiaSenegalSerbiaSeychellesSierra LeoneSingaporeSlovak RepublicSloveniaSmall statesSolomon IslandsSouth AfricaSouth AsiaSouth Asia (IDA & IBRD)SpainSri LankaSt. Kitts and NevisSt. LuciaSt. Vincent and the GrenadinesSub-Saharan Africa Sub-Saharan Africa (excluding high income)Sub-Saharan Africa (IDA & IBRD countries)SudanSurinameSwazilandSwedenSwitzerlandSyrian Arab RepublicTajikistanTanzaniaThailandTimor-LesteTogoTongaTrinidad and TobagoTunisiaTurkeyTurkmenistanUgandaUkraineUnited Arab EmiratesUnited KingdomUnited StatesUpper middle incomeUruguayUzbekistanVanuatuVenezuela, RBVietnamWest Bank and GazaWorldYemen, Rep.ZambiaZimbabwe línea de tiempo (timeline):
En esta escala de tiempo se presenta un gráfico de 1971 y 2015 de Other small states. Los datos de 1970 están ausentes. El número de observaciones reales por fecha: 45.
Fuente (nombre):
Indicadores del desarrollo mundial
Fuente (organización):
World Bank staff estimates based on Samuel Fankhauser's "Valuing Climate Change: The Economics of the Greenhouse" (1995).
Categorías:
Economy & Growth, Environment
Se ha actualizado:
23 abr 2017 año
Los indicadores de los cambios de valor en los últimos años
Mínimo:
0.419
1 ene 1981 año
Máximo:
1.026
1 ene 1972 año
A la fecha de observación
Valor
Cambio absoluto
El cambio con respecto al valor anterior
1 ene 1971 año
0.947
+0.947
0.0%
1 ene 1972 año
1.026
+0.079
8.37%
1 ene 1973 año
0.96
-0.066
-6.43%
1 ene 1974 año
0.924
-0.036
-3.78%
1 ene 1975 año
0.508
-0.416
-45.02%
1 ene 1976 año
0.541
+0.033
6.49%
1 ene 1977 año
0.463
-0.078
-14.43%
1 ene 1978 año
0.468
+0.005
1.12%
1 ene 1979 año
0.509
+0.041
8.78%
1 ene 1980 año
0.494
-0.015
-2.94%
1 ene 1981 año
0.419
-0.075
-15.26%
1 ene 1982 año
0.445
+0.026
6.19%
1 ene 1983 año
0.52
+0.076
16.98%
1 ene 1984 año
0.527
+0.007
1.28%
1 ene 1985 año
0.593
+0.066
12.5%
1 ene 1986 año
0.655
+0.062
10.54%
1 ene 1987 año
0.671
+0.016
2.37%
1 ene 1988 año
0.582
-0.089
-13.27%
1 ene 1989 año
0.563
-0.018
-3.14%
1 ene 1990 año
0.66
+0.096
17.05%
1 ene 1991 año
0.52
-0.139
-21.13%
1 ene 1992 año
0.54
+0.02
3.76%
1 ene 1993 año
0.624
+0.084
15.54%
1 ene 1994 año
0.789
+0.165
26.48%
1 ene 1995 año
0.786
-0.003
-0.34%
1 ene 1996 año
0.721
-0.065
-8.28%
1 ene 1997 año
0.715
-0.006
-0.89%
1 ene 1998 año
0.785
+0.071
9.87%
1 ene 1999 año
0.553
-0.232
-29.58%
1 ene 2000 año
0.536
-0.017
-3.07%
1 ene 2001 año
0.662
+0.126
23.51%
1 ene 2002 año
0.688
+0.026
3.99%
1 ene 2003 año
0.679
-0.01
-1.4%
1 ene 2004 año
0.604
-0.075
-11.03%
1 ene 2005 año
0.673
+0.069
11.41%
1 ene 2006 año
0.632
-0.04
-5.97%
1 ene 2007 año
0.568
-0.065
-10.25%
1 ene 2008 año
0.552
-0.015
-2.69%
1 ene 2009 año
0.491
-0.061
-11.04%
1 ene 2010 año
0.587
+0.095
19.39%
1 ene 2011 año
0.549
-0.037
-6.36%
1 ene 2012 año
0.475
-0.074
-13.49%
1 ene 2013 año
0.488
+0.012
2.62%
1 ene 2014 año
0.487
-0.001
-0.2%
1 ene 2015 año
0.489
+0.002
0.37%
Ranking de los países por los datos estadísticos actuales


Comentarios: