29
/es/
es
AIzaSyAYiBZKx7MnpbEhh9jyipgxe19OcubqV5w
April 1, 2024
154179
India
IND
true
2
1
Adjusted savings: carbon dioxide damage (% of GNI)
2015,2014,2013,2012,2011,2010,2009,2008,2007,2006,2005,2004,2003,2002,2001,2000,1999,1998,1997,1996,1995,1994,1993,1992,1991,1990,1989,1988,1987,1986,1985,1984,1983,1982,1981,1980,1979,1978,1977,1976,1975,1974,1973,1972,1971
Estas estadísticas en otros países:
AfghanistanAlbaniaAlgeriaAndorraAngolaAntigua and BarbudaArab WorldArgentinaArmeniaAustraliaAustriaAzerbaijanBahamas, TheBahrainBangladeshBarbadosBelarusBelgiumBelizeBeninBermudaBhutanBoliviaBosnia and HerzegovinaBotswanaBrazilBrunei DarussalamBulgariaBurkina FasoBurundiCabo VerdeCambodiaCameroonCanadaCaribbean small statesCentral African RepublicCentral Europe and the BalticsChadChileChinaColombiaComorosCongo, Dem. Rep.Congo, Rep.Costa RicaCote d'IvoireCroatiaCubaCyprusCzech RepublicDenmarkDjiboutiDominicaDominican RepublicEarly-demographic dividendEast Asia & PacificEast Asia & Pacific (excluding high income)East Asia & Pacific (IDA & IBRD countries)EcuadorEgypt, Arab Rep.El SalvadorEquatorial GuineaEritreaEstoniaEthiopiaEuro areaEurope & Central AsiaEurope & Central Asia (excluding high income)Europe & Central Asia (IDA & IBRD countries)European UnionFaroe IslandsFijiFinlandFragile and conflict affected situationsFranceFrench PolynesiaGabonGambia, TheGeorgiaGermanyGhanaGreeceGreenlandGrenadaGuatemalaGuineaGuinea-BissauGuyanaHaitiHeavily indebted poor countries (HIPC)High incomeHondurasHong Kong SAR, ChinaHungaryIBRD onlyIcelandIDA & IBRD totalIDA blendIDA onlyIDA totalIndiaIndonesiaIran, Islamic Rep.IraqIrelandIsraelItalyJamaicaJapanJordanKazakhstanKenyaKiribatiKorea, Rep.KuwaitKyrgyz RepublicLao PDRLate-demographic dividendLatin America & Caribbean Latin America & Caribbean (excluding high income)Latin America & the Caribbean (IDA & IBRD countries)LatviaLeast developed countries: UN classificationLebanonLesothoLiberiaLibyaLiechtensteinLithuaniaLow & middle incomeLow incomeLower middle incomeLuxembourgMacao SAR, ChinaMacedonia, FYRMadagascarMalawiMalaysiaMaldivesMaliMaltaMarshall IslandsMauritaniaMauritiusMexicoMicronesia, Fed. Sts.Middle East & North AfricaMiddle East & North Africa (excluding high income)Middle East & North Africa (IDA & IBRD countries)Middle incomeMoldovaMongoliaMontenegroMoroccoMozambiqueNamibiaNepalNetherlandsNew CaledoniaNew ZealandNicaraguaNigerNigeriaNorth AmericaNorwayOECD membersOmanOther small statesPacific island small statesPakistanPalauPanamaPapua New GuineaParaguayPeruPhilippinesPolandPortugalPost-demographic dividendPre-demographic dividendQatarRomaniaRussian FederationRwandaSamoaSao Tome and PrincipeSaudi ArabiaSenegalSerbiaSeychellesSierra LeoneSingaporeSlovak RepublicSloveniaSmall statesSolomon IslandsSouth AfricaSouth AsiaSouth Asia (IDA & IBRD)SpainSri LankaSt. Kitts and NevisSt. LuciaSt. Vincent and the GrenadinesSub-Saharan Africa Sub-Saharan Africa (excluding high income)Sub-Saharan Africa (IDA & IBRD countries)SudanSurinameSwazilandSwedenSwitzerlandSyrian Arab RepublicTajikistanTanzaniaThailandTimor-LesteTogoTongaTrinidad and TobagoTunisiaTurkeyTurkmenistanUgandaUkraineUnited Arab EmiratesUnited KingdomUnited StatesUpper middle incomeUruguayUzbekistanVanuatuVenezuela, RBVietnamWest Bank and GazaWorldYemen, Rep.ZambiaZimbabwe línea de tiempo (timeline):
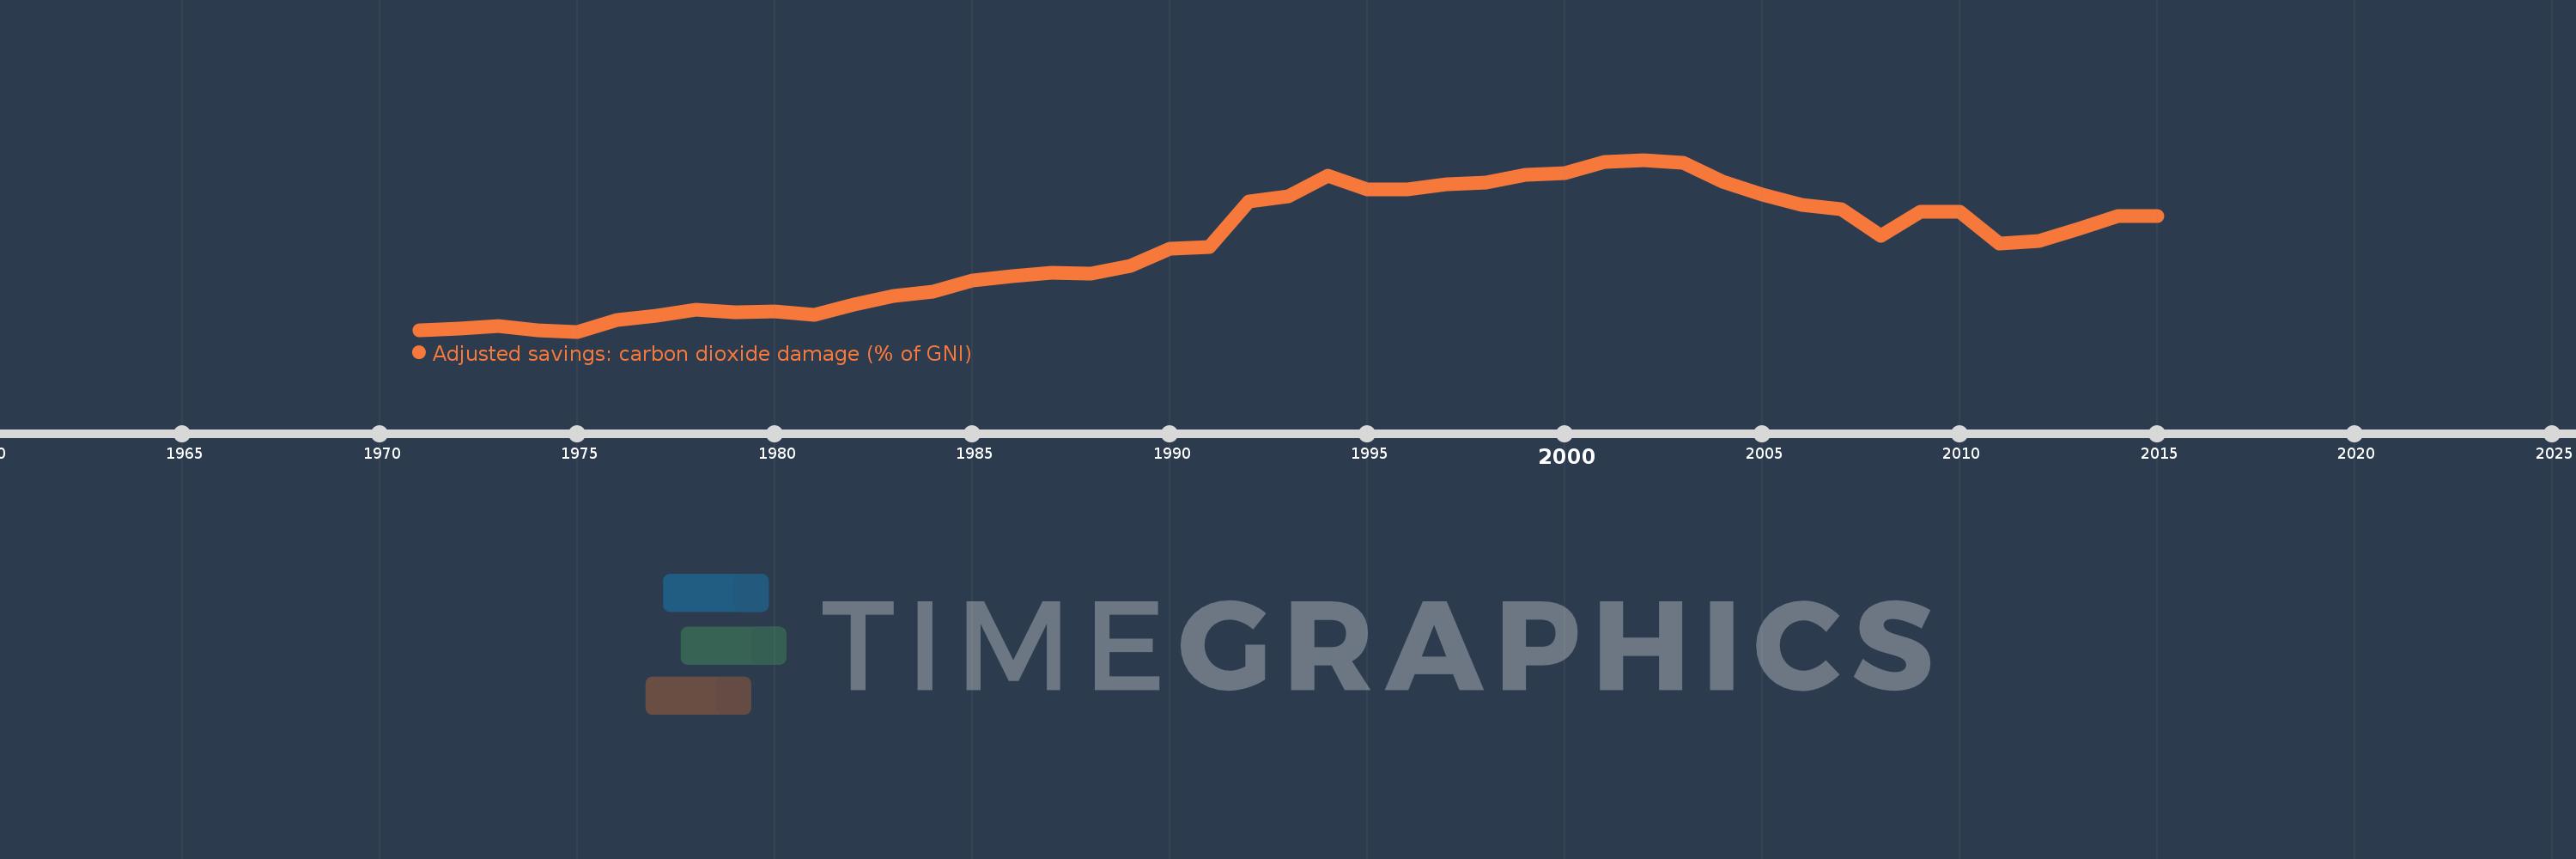
En esta escala de tiempo se presenta un gráfico de 1971 y 2015 de India. Los datos de 1970 están ausentes. El número de observaciones reales por fecha: 45.
Fuente (nombre):
Indicadores del desarrollo mundial
Fuente (organización):
World Bank staff estimates based on Samuel Fankhauser's "Valuing Climate Change: The Economics of the Greenhouse" (1995).
Categorías:
Economy & Growth, Environment
Se ha actualizado:
23 abr 2017 año
Los indicadores de los cambios de valor en los últimos años
Mínimo:
0.405
1 ene 1975 año
Máximo:
1.732
1 ene 2002 año
A la fecha de observación
Valor
Cambio absoluto
El cambio con respecto al valor anterior
1 ene 1971 año
0.413
+0.413
0.0%
1 ene 1972 año
0.429
+0.016
3.92%
1 ene 1973 año
0.451
+0.022
5.24%
1 ene 1974 año
0.414
-0.037
-8.25%
1 ene 1975 año
0.405
-0.009
-2.14%
1 ene 1976 año
0.492
+0.087
21.38%
1 ene 1977 año
0.526
+0.034
6.97%
1 ene 1978 año
0.572
+0.046
8.69%
1 ene 1979 año
0.551
-0.02
-3.56%
1 ene 1980 año
0.564
+0.013
2.33%
1 ene 1981 año
0.536
-0.028
-5.0%
1 ene 1982 año
0.615
+0.079
14.78%
1 ene 1983 año
0.68
+0.065
10.49%
1 ene 1984 año
0.714
+0.034
5.04%
1 ene 1985 año
0.797
+0.083
11.63%
1 ene 1986 año
0.832
+0.035
4.45%
1 ene 1987 año
0.861
+0.028
3.41%
1 ene 1988 año
0.852
-0.008
-0.98%
1 ene 1989 año
0.91
+0.057
6.71%
1 ene 1990 año
1.048
+0.139
15.27%
1 ene 1991 año
1.058
+0.01
0.95%
1 ene 1992 año
1.408
+0.349
33.02%
1 ene 1993 año
1.45
+0.042
3.01%
1 ene 1994 año
1.608
+0.158
10.9%
1 ene 1995 año
1.505
-0.104
-6.44%
1 ene 1996 año
1.5
-0.005
-0.35%
1 ene 1997 año
1.54
+0.041
2.72%
1 ene 1998 año
1.559
+0.018
1.19%
1 ene 1999 año
1.615
+0.057
3.64%
1 ene 2000 año
1.626
+0.01
0.65%
1 ene 2001 año
1.714
+0.088
5.41%
1 ene 2002 año
1.732
+0.019
1.1%
1 ene 2003 año
1.706
-0.026
-1.5%
1 ene 2004 año
1.56
-0.146
-8.56%
1 ene 2005 año
1.462
-0.099
-6.32%
1 ene 2006 año
1.381
-0.081
-5.52%
1 ene 2007 año
1.349
-0.032
-2.34%
1 ene 2008 año
1.144
-0.205
-15.18%
1 ene 2009 año
1.33
+0.186
16.24%
1 ene 2010 año
1.331
+0.001
0.08%
1 ene 2011 año
1.085
-0.246
-18.49%
1 ene 2012 año
1.105
+0.02
1.87%
1 ene 2013 año
1.201
+0.096
8.66%
1 ene 2014 año
1.296
+0.095
7.93%
1 ene 2015 año
1.295
0.0
-0.03%
Ranking de los países por los datos estadísticos actuales


Comentarios: