29
/es/
es
AIzaSyAYiBZKx7MnpbEhh9jyipgxe19OcubqV5w
April 1, 2024
243298
Solomon Islands
SLB
true
2
1
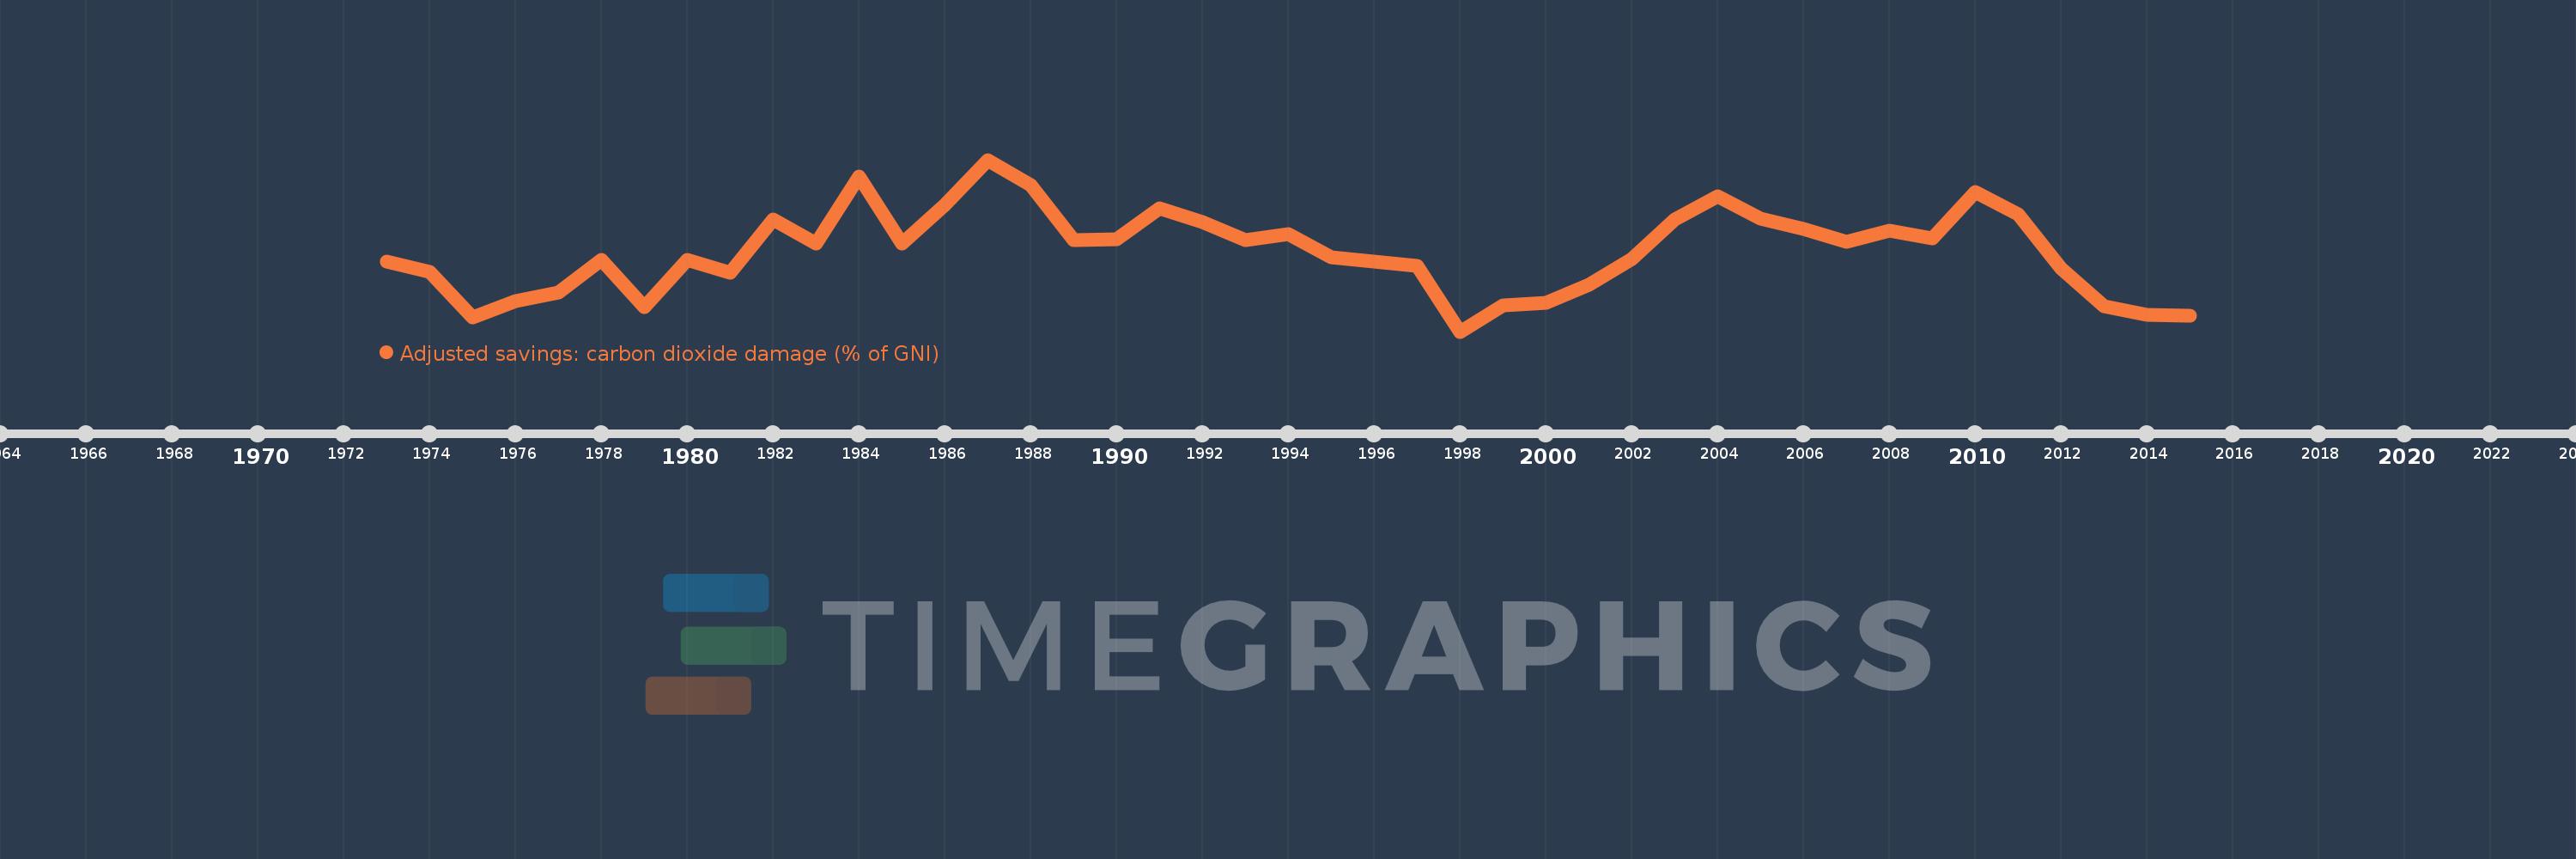
Adjusted savings: carbon dioxide damage (% of GNI)
2015,2014,2013,2012,2011,2010,2009,2008,2007,2006,2005,2004,2003,2002,2001,2000,1999,1998,1997,1996,1995,1994,1993,1992,1991,1990,1989,1988,1987,1986,1985,1984,1983,1982,1981,1980,1979,1978,1977,1976,1975,1974,1973
Estas estadísticas en otros países:
AfghanistanAlbaniaAlgeriaAndorraAngolaAntigua and BarbudaArab WorldArgentinaArmeniaAustraliaAustriaAzerbaijanBahamas, TheBahrainBangladeshBarbadosBelarusBelgiumBelizeBeninBermudaBhutanBoliviaBosnia and HerzegovinaBotswanaBrazilBrunei DarussalamBulgariaBurkina FasoBurundiCabo VerdeCambodiaCameroonCanadaCaribbean small statesCentral African RepublicCentral Europe and the BalticsChadChileChinaColombiaComorosCongo, Dem. Rep.Congo, Rep.Costa RicaCote d'IvoireCroatiaCubaCyprusCzech RepublicDenmarkDjiboutiDominicaDominican RepublicEarly-demographic dividendEast Asia & PacificEast Asia & Pacific (excluding high income)East Asia & Pacific (IDA & IBRD countries)EcuadorEgypt, Arab Rep.El SalvadorEquatorial GuineaEritreaEstoniaEthiopiaEuro areaEurope & Central AsiaEurope & Central Asia (excluding high income)Europe & Central Asia (IDA & IBRD countries)European UnionFaroe IslandsFijiFinlandFragile and conflict affected situationsFranceFrench PolynesiaGabonGambia, TheGeorgiaGermanyGhanaGreeceGreenlandGrenadaGuatemalaGuineaGuinea-BissauGuyanaHaitiHeavily indebted poor countries (HIPC)High incomeHondurasHong Kong SAR, ChinaHungaryIBRD onlyIcelandIDA & IBRD totalIDA blendIDA onlyIDA totalIndiaIndonesiaIran, Islamic Rep.IraqIrelandIsraelItalyJamaicaJapanJordanKazakhstanKenyaKiribatiKorea, Rep.KuwaitKyrgyz RepublicLao PDRLate-demographic dividendLatin America & Caribbean Latin America & Caribbean (excluding high income)Latin America & the Caribbean (IDA & IBRD countries)LatviaLeast developed countries: UN classificationLebanonLesothoLiberiaLibyaLiechtensteinLithuaniaLow & middle incomeLow incomeLower middle incomeLuxembourgMacao SAR, ChinaMacedonia, FYRMadagascarMalawiMalaysiaMaldivesMaliMaltaMarshall IslandsMauritaniaMauritiusMexicoMicronesia, Fed. Sts.Middle East & North AfricaMiddle East & North Africa (excluding high income)Middle East & North Africa (IDA & IBRD countries)Middle incomeMoldovaMongoliaMontenegroMoroccoMozambiqueNamibiaNepalNetherlandsNew CaledoniaNew ZealandNicaraguaNigerNigeriaNorth AmericaNorwayOECD membersOmanOther small statesPacific island small statesPakistanPalauPanamaPapua New GuineaParaguayPeruPhilippinesPolandPortugalPost-demographic dividendPre-demographic dividendQatarRomaniaRussian FederationRwandaSamoaSao Tome and PrincipeSaudi ArabiaSenegalSerbiaSeychellesSierra LeoneSingaporeSlovak RepublicSloveniaSmall statesSolomon IslandsSouth AfricaSouth AsiaSouth Asia (IDA & IBRD)SpainSri LankaSt. Kitts and NevisSt. LuciaSt. Vincent and the GrenadinesSub-Saharan Africa Sub-Saharan Africa (excluding high income)Sub-Saharan Africa (IDA & IBRD countries)SudanSurinameSwazilandSwedenSwitzerlandSyrian Arab RepublicTajikistanTanzaniaThailandTimor-LesteTogoTongaTrinidad and TobagoTunisiaTurkeyTurkmenistanUgandaUkraineUnited Arab EmiratesUnited KingdomUnited StatesUpper middle incomeUruguayUzbekistanVanuatuVenezuela, RBVietnamWest Bank and GazaWorldYemen, Rep.ZambiaZimbabwe línea de tiempo (timeline):
En esta escala de tiempo se presenta un gráfico de 1973 y 2015 de Solomon Islands. Los datos de 1972 están ausentes. El número de observaciones reales por fecha: 43.
Fuente (nombre):
Indicadores del desarrollo mundial
Fuente (organización):
World Bank staff estimates based on Samuel Fankhauser's "Valuing Climate Change: The Economics of the Greenhouse" (1995).
Categorías:
Economy & Growth, Environment
Se ha actualizado:
23 abr 2017 año
Los indicadores de los cambios de valor en los últimos años
Mínimo:
0.18
1 ene 1998 año
Máximo:
0.466
1 ene 1987 año
A la fecha de observación
Valor
Cambio absoluto
El cambio con respecto al valor anterior
1 ene 1973 año
0.297
+0.297
0.0%
1 ene 1974 año
0.279
-0.019
-6.26%
1 ene 1975 año
0.203
-0.075
-27.02%
1 ene 1976 año
0.231
+0.028
13.53%
1 ene 1977 año
0.245
+0.014
6.05%
1 ene 1978 año
0.3
+0.055
22.65%
1 ene 1979 año
0.221
-0.079
-26.42%
1 ene 1980 año
0.299
+0.078
35.45%
1 ene 1981 año
0.278
-0.021
-7.09%
1 ene 1982 año
0.366
+0.087
31.42%
1 ene 1983 año
0.327
-0.039
-10.53%
1 ene 1984 año
0.438
+0.111
33.82%
1 ene 1985 año
0.326
-0.112
-25.54%
1 ene 1986 año
0.391
+0.065
20.04%
1 ene 1987 año
0.466
+0.075
19.06%
1 ene 1988 año
0.424
-0.041
-8.91%
1 ene 1989 año
0.333
-0.091
-21.47%
1 ene 1990 año
0.334
+0.0
0.14%
1 ene 1991 año
0.385
+0.051
15.26%
1 ene 1992 año
0.362
-0.023
-5.94%
1 ene 1993 año
0.333
-0.028
-7.81%
1 ene 1994 año
0.342
+0.009
2.57%
1 ene 1995 año
0.304
-0.038
-11.11%
1 ene 1996 año
0.297
-0.007
-2.21%
1 ene 1997 año
0.29
-0.007
-2.41%
1 ene 1998 año
0.18
-0.11
-37.82%
1 ene 1999 año
0.223
+0.042
23.51%
1 ene 2000 año
0.228
+0.005
2.32%
1 ene 2001 año
0.258
+0.03
13.2%
1 ene 2002 año
0.301
+0.043
16.81%
1 ene 2003 año
0.367
+0.066
21.84%
1 ene 2004 año
0.405
+0.037
10.15%
1 ene 2005 año
0.368
-0.036
-8.93%
1 ene 2006 año
0.351
-0.018
-4.86%
1 ene 2007 año
0.329
-0.021
-6.1%
1 ene 2008 año
0.348
+0.019
5.8%
1 ene 2009 año
0.335
-0.013
-3.86%
1 ene 2010 año
0.413
+0.078
23.23%
1 ene 2011 año
0.375
-0.038
-9.15%
1 ene 2012 año
0.285
-0.089
-23.85%
1 ene 2013 año
0.222
-0.064
-22.27%
1 ene 2014 año
0.208
-0.014
-6.4%
1 ene 2015 año
0.207
-0.001
-0.5%
Ranking de los países por los datos estadísticos actuales


Comentarios: