29
/es/
es
AIzaSyAYiBZKx7MnpbEhh9jyipgxe19OcubqV5w
April 1, 2024
155536
Indonesia
IDN
true
2
1
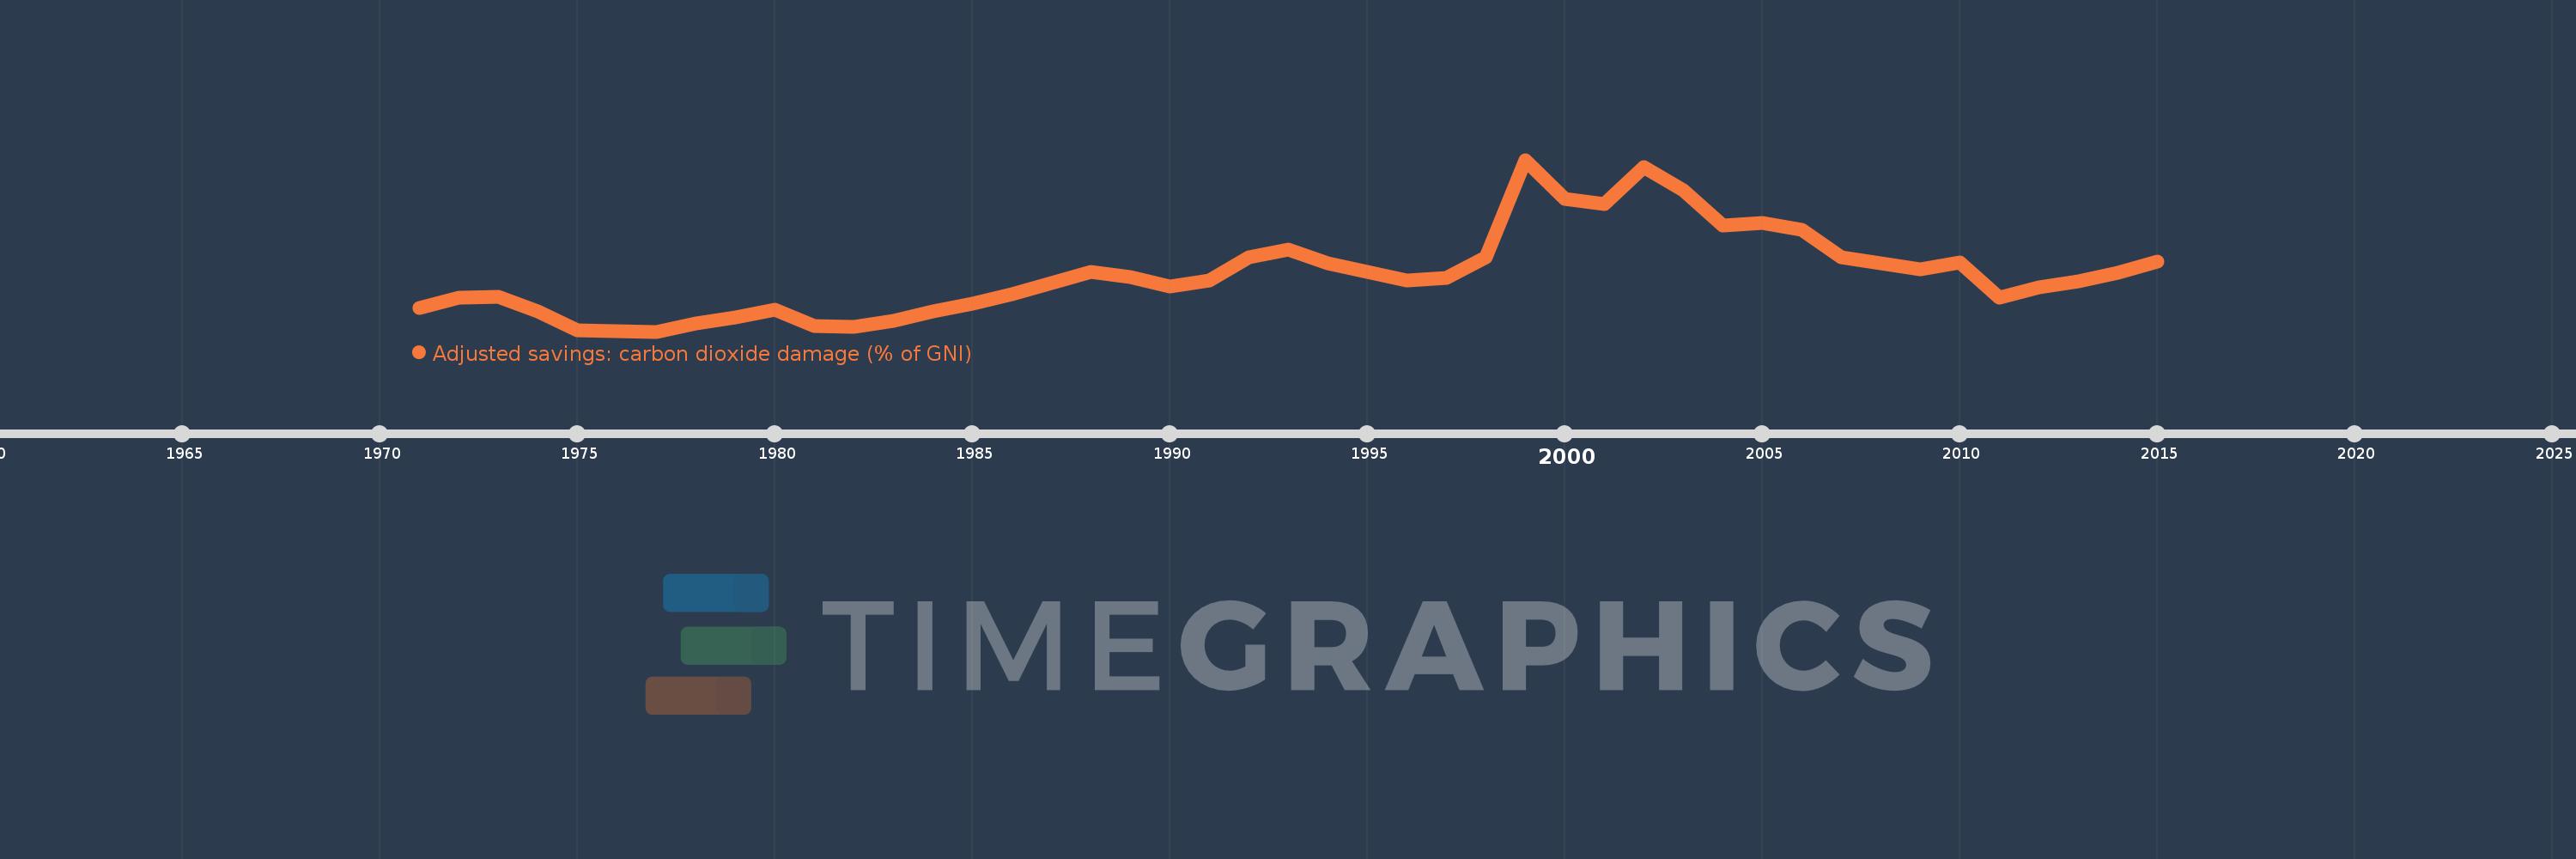
Adjusted savings: carbon dioxide damage (% of GNI)
2015,2014,2013,2012,2011,2010,2009,2008,2007,2006,2005,2004,2003,2002,2001,2000,1999,1998,1997,1996,1995,1994,1993,1992,1991,1990,1989,1988,1987,1986,1985,1984,1983,1982,1981,1980,1979,1978,1977,1976,1975,1974,1973,1972,1971
Estas estadísticas en otros países:
AfghanistanAlbaniaAlgeriaAndorraAngolaAntigua and BarbudaArab WorldArgentinaArmeniaAustraliaAustriaAzerbaijanBahamas, TheBahrainBangladeshBarbadosBelarusBelgiumBelizeBeninBermudaBhutanBoliviaBosnia and HerzegovinaBotswanaBrazilBrunei DarussalamBulgariaBurkina FasoBurundiCabo VerdeCambodiaCameroonCanadaCaribbean small statesCentral African RepublicCentral Europe and the BalticsChadChileChinaColombiaComorosCongo, Dem. Rep.Congo, Rep.Costa RicaCote d'IvoireCroatiaCubaCyprusCzech RepublicDenmarkDjiboutiDominicaDominican RepublicEarly-demographic dividendEast Asia & PacificEast Asia & Pacific (excluding high income)East Asia & Pacific (IDA & IBRD countries)EcuadorEgypt, Arab Rep.El SalvadorEquatorial GuineaEritreaEstoniaEthiopiaEuro areaEurope & Central AsiaEurope & Central Asia (excluding high income)Europe & Central Asia (IDA & IBRD countries)European UnionFaroe IslandsFijiFinlandFragile and conflict affected situationsFranceFrench PolynesiaGabonGambia, TheGeorgiaGermanyGhanaGreeceGreenlandGrenadaGuatemalaGuineaGuinea-BissauGuyanaHaitiHeavily indebted poor countries (HIPC)High incomeHondurasHong Kong SAR, ChinaHungaryIBRD onlyIcelandIDA & IBRD totalIDA blendIDA onlyIDA totalIndiaIndonesiaIran, Islamic Rep.IraqIrelandIsraelItalyJamaicaJapanJordanKazakhstanKenyaKiribatiKorea, Rep.KuwaitKyrgyz RepublicLao PDRLate-demographic dividendLatin America & Caribbean Latin America & Caribbean (excluding high income)Latin America & the Caribbean (IDA & IBRD countries)LatviaLeast developed countries: UN classificationLebanonLesothoLiberiaLibyaLiechtensteinLithuaniaLow & middle incomeLow incomeLower middle incomeLuxembourgMacao SAR, ChinaMacedonia, FYRMadagascarMalawiMalaysiaMaldivesMaliMaltaMarshall IslandsMauritaniaMauritiusMexicoMicronesia, Fed. Sts.Middle East & North AfricaMiddle East & North Africa (excluding high income)Middle East & North Africa (IDA & IBRD countries)Middle incomeMoldovaMongoliaMontenegroMoroccoMozambiqueNamibiaNepalNetherlandsNew CaledoniaNew ZealandNicaraguaNigerNigeriaNorth AmericaNorwayOECD membersOmanOther small statesPacific island small statesPakistanPalauPanamaPapua New GuineaParaguayPeruPhilippinesPolandPortugalPost-demographic dividendPre-demographic dividendQatarRomaniaRussian FederationRwandaSamoaSao Tome and PrincipeSaudi ArabiaSenegalSerbiaSeychellesSierra LeoneSingaporeSlovak RepublicSloveniaSmall statesSolomon IslandsSouth AfricaSouth AsiaSouth Asia (IDA & IBRD)SpainSri LankaSt. Kitts and NevisSt. LuciaSt. Vincent and the GrenadinesSub-Saharan Africa Sub-Saharan Africa (excluding high income)Sub-Saharan Africa (IDA & IBRD countries)SudanSurinameSwazilandSwedenSwitzerlandSyrian Arab RepublicTajikistanTanzaniaThailandTimor-LesteTogoTongaTrinidad and TobagoTunisiaTurkeyTurkmenistanUgandaUkraineUnited Arab EmiratesUnited KingdomUnited StatesUpper middle incomeUruguayUzbekistanVanuatuVenezuela, RBVietnamWest Bank and GazaWorldYemen, Rep.ZambiaZimbabwe línea de tiempo (timeline):
En esta escala de tiempo se presenta un gráfico de 1971 y 2015 de Indonesia. Los datos de 1970 están ausentes. El número de observaciones reales por fecha: 45.
Fuente (nombre):
Indicadores del desarrollo mundial
Fuente (organización):
World Bank staff estimates based on Samuel Fankhauser's "Valuing Climate Change: The Economics of the Greenhouse" (1995).
Categorías:
Economy & Growth, Environment
Se ha actualizado:
23 abr 2017 año
Los indicadores de los cambios de valor en los últimos años
Mínimo:
0.331
1 ene 1977 año
Máximo:
1.496
1 ene 1999 año
A la fecha de observación
Valor
Cambio absoluto
El cambio con respecto al valor anterior
1 ene 1971 año
0.493
+0.493
0.0%
1 ene 1972 año
0.561
+0.068
13.84%
1 ene 1973 año
0.567
+0.005
0.93%
1 ene 1974 año
0.465
-0.101
-17.86%
1 ene 1975 año
0.341
-0.124
-26.67%
1 ene 1976 año
0.335
-0.006
-1.7%
1 ene 1977 año
0.331
-0.005
-1.39%
1 ene 1978 año
0.387
+0.056
16.98%
1 ene 1979 año
0.427
+0.04
10.26%
1 ene 1980 año
0.478
+0.051
11.96%
1 ene 1981 año
0.37
-0.107
-22.49%
1 ene 1982 año
0.362
-0.008
-2.22%
1 ene 1983 año
0.406
+0.044
12.21%
1 ene 1984 año
0.468
+0.062
15.27%
1 ene 1985 año
0.52
+0.052
11.13%
1 ene 1986 año
0.585
+0.065
12.47%
1 ene 1987 año
0.661
+0.075
12.87%
1 ene 1988 año
0.734
+0.074
11.14%
1 ene 1989 año
0.699
-0.035
-4.75%
1 ene 1990 año
0.637
-0.063
-8.97%
1 ene 1991 año
0.677
+0.04
6.31%
1 ene 1992 año
0.836
+0.159
23.56%
1 ene 1993 año
0.888
+0.052
6.24%
1 ene 1994 año
0.796
-0.092
-10.36%
1 ene 1995 año
0.736
-0.06
-7.6%
1 ene 1996 año
0.678
-0.058
-7.93%
1 ene 1997 año
0.697
+0.019
2.85%
1 ene 1998 año
0.834
+0.137
19.61%
1 ene 1999 año
1.496
+0.662
79.41%
1 ene 2000 año
1.231
-0.264
-17.66%
1 ene 2001 año
1.194
-0.038
-3.08%
1 ene 2002 año
1.449
+0.256
21.43%
1 ene 2003 año
1.288
-0.161
-11.11%
1 ene 2004 año
1.048
-0.24
-18.62%
1 ene 2005 año
1.07
+0.022
2.07%
1 ene 2006 año
1.019
-0.051
-4.75%
1 ene 2007 año
0.835
-0.185
-18.1%
1 ene 2008 año
0.794
-0.041
-4.93%
1 ene 2009 año
0.756
-0.037
-4.71%
1 ene 2010 año
0.8
+0.043
5.73%
1 ene 2011 año
0.559
-0.24
-30.06%
1 ene 2012 año
0.631
+0.072
12.83%
1 ene 2013 año
0.669
+0.038
6.03%
1 ene 2014 año
0.731
+0.062
9.24%
1 ene 2015 año
0.808
+0.077
10.52%
Ranking de los países por los datos estadísticos actuales


Comentarios: