29
/es/
es
AIzaSyAYiBZKx7MnpbEhh9jyipgxe19OcubqV5w
April 1, 2024
100797
Canada
CAN
true
2
1
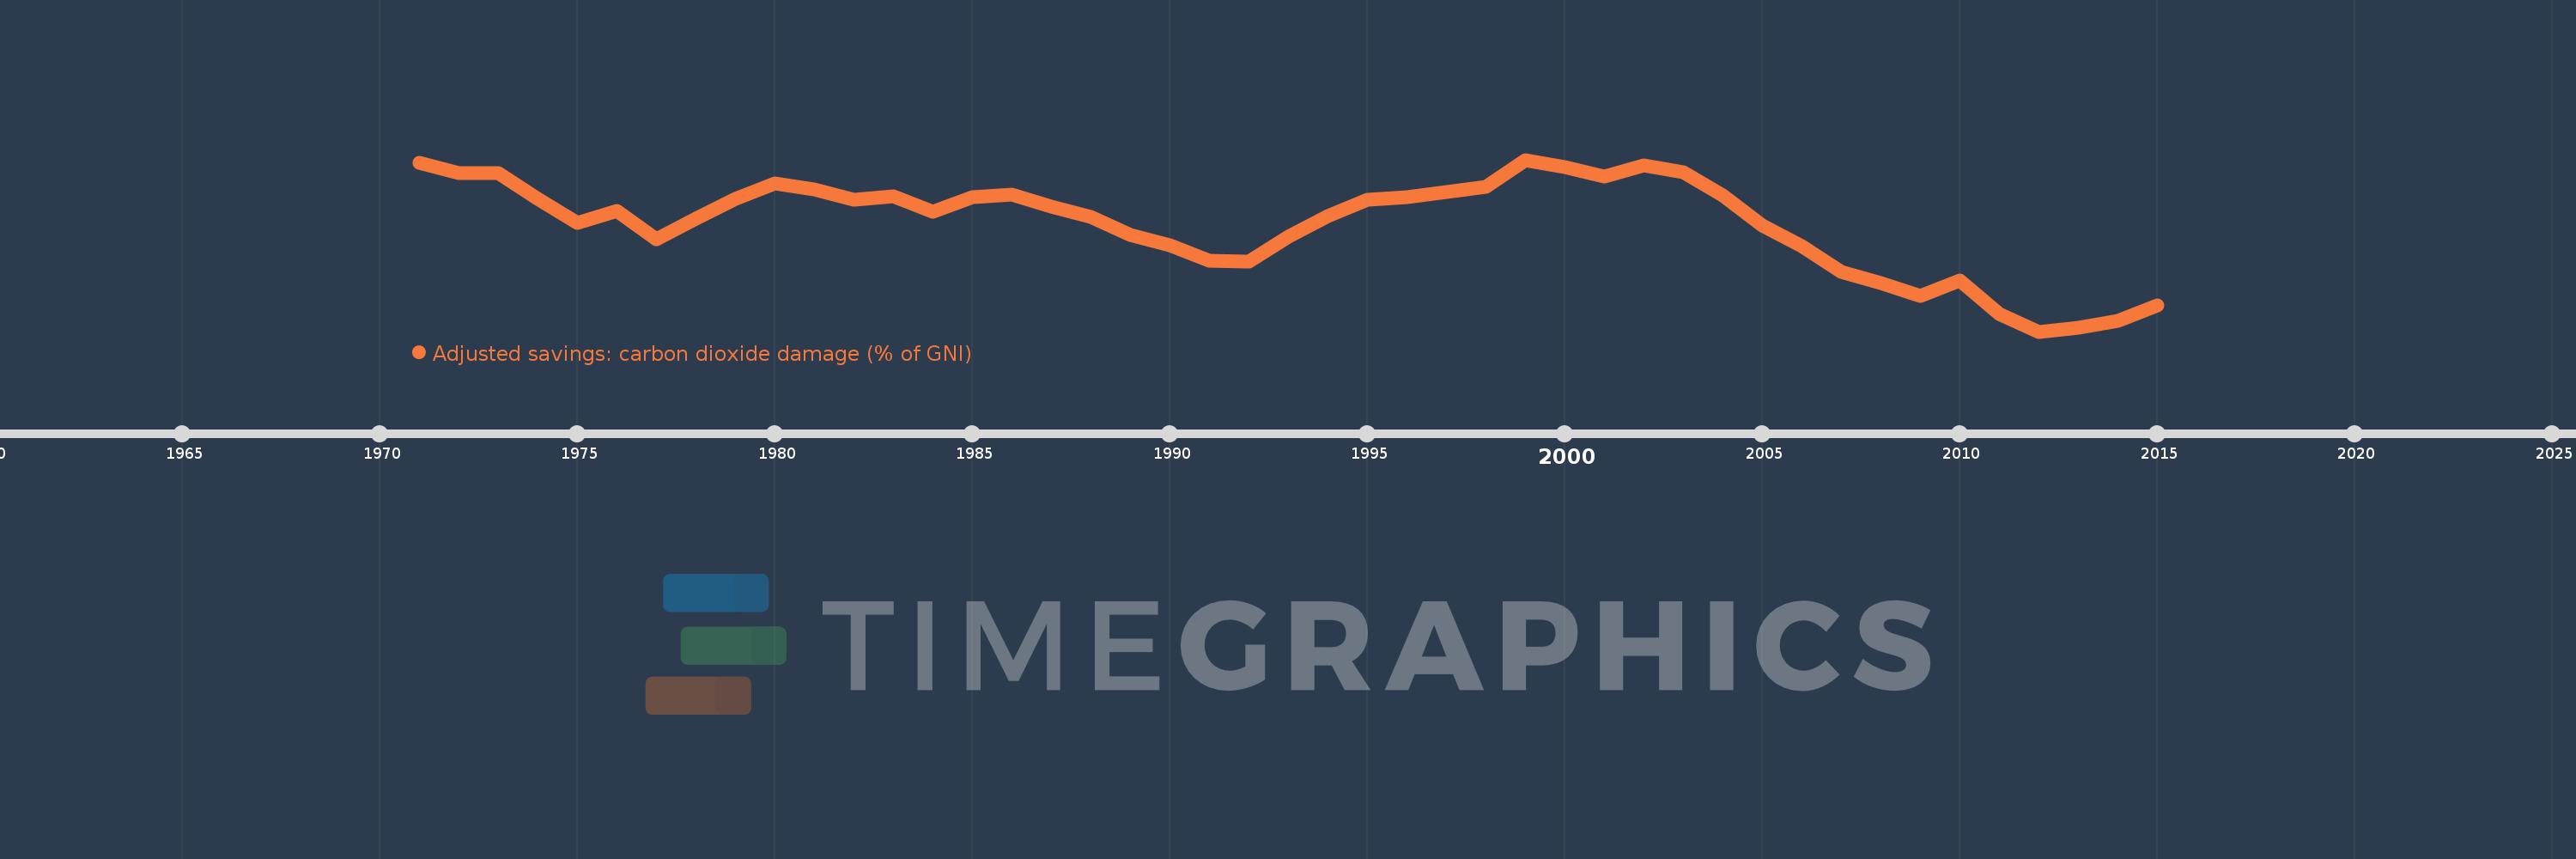
Adjusted savings: carbon dioxide damage (% of GNI)
2015,2014,2013,2012,2011,2010,2009,2008,2007,2006,2005,2004,2003,2002,2001,2000,1999,1998,1997,1996,1995,1994,1993,1992,1991,1990,1989,1988,1987,1986,1985,1984,1983,1982,1981,1980,1979,1978,1977,1976,1975,1974,1973,1972,1971
Estas estadísticas en otros países:
AfghanistanAlbaniaAlgeriaAndorraAngolaAntigua and BarbudaArab WorldArgentinaArmeniaAustraliaAustriaAzerbaijanBahamas, TheBahrainBangladeshBarbadosBelarusBelgiumBelizeBeninBermudaBhutanBoliviaBosnia and HerzegovinaBotswanaBrazilBrunei DarussalamBulgariaBurkina FasoBurundiCabo VerdeCambodiaCameroonCanadaCaribbean small statesCentral African RepublicCentral Europe and the BalticsChadChileChinaColombiaComorosCongo, Dem. Rep.Congo, Rep.Costa RicaCote d'IvoireCroatiaCubaCyprusCzech RepublicDenmarkDjiboutiDominicaDominican RepublicEarly-demographic dividendEast Asia & PacificEast Asia & Pacific (excluding high income)East Asia & Pacific (IDA & IBRD countries)EcuadorEgypt, Arab Rep.El SalvadorEquatorial GuineaEritreaEstoniaEthiopiaEuro areaEurope & Central AsiaEurope & Central Asia (excluding high income)Europe & Central Asia (IDA & IBRD countries)European UnionFaroe IslandsFijiFinlandFragile and conflict affected situationsFranceFrench PolynesiaGabonGambia, TheGeorgiaGermanyGhanaGreeceGreenlandGrenadaGuatemalaGuineaGuinea-BissauGuyanaHaitiHeavily indebted poor countries (HIPC)High incomeHondurasHong Kong SAR, ChinaHungaryIBRD onlyIcelandIDA & IBRD totalIDA blendIDA onlyIDA totalIndiaIndonesiaIran, Islamic Rep.IraqIrelandIsraelItalyJamaicaJapanJordanKazakhstanKenyaKiribatiKorea, Rep.KuwaitKyrgyz RepublicLao PDRLate-demographic dividendLatin America & Caribbean Latin America & Caribbean (excluding high income)Latin America & the Caribbean (IDA & IBRD countries)LatviaLeast developed countries: UN classificationLebanonLesothoLiberiaLibyaLiechtensteinLithuaniaLow & middle incomeLow incomeLower middle incomeLuxembourgMacao SAR, ChinaMacedonia, FYRMadagascarMalawiMalaysiaMaldivesMaliMaltaMarshall IslandsMauritaniaMauritiusMexicoMicronesia, Fed. Sts.Middle East & North AfricaMiddle East & North Africa (excluding high income)Middle East & North Africa (IDA & IBRD countries)Middle incomeMoldovaMongoliaMontenegroMoroccoMozambiqueNamibiaNepalNetherlandsNew CaledoniaNew ZealandNicaraguaNigerNigeriaNorth AmericaNorwayOECD membersOmanOther small statesPacific island small statesPakistanPalauPanamaPapua New GuineaParaguayPeruPhilippinesPolandPortugalPost-demographic dividendPre-demographic dividendQatarRomaniaRussian FederationRwandaSamoaSao Tome and PrincipeSaudi ArabiaSenegalSerbiaSeychellesSierra LeoneSingaporeSlovak RepublicSloveniaSmall statesSolomon IslandsSouth AfricaSouth AsiaSouth Asia (IDA & IBRD)SpainSri LankaSt. Kitts and NevisSt. LuciaSt. Vincent and the GrenadinesSub-Saharan Africa Sub-Saharan Africa (excluding high income)Sub-Saharan Africa (IDA & IBRD countries)SudanSurinameSwazilandSwedenSwitzerlandSyrian Arab RepublicTajikistanTanzaniaThailandTimor-LesteTogoTongaTrinidad and TobagoTunisiaTurkeyTurkmenistanUgandaUkraineUnited Arab EmiratesUnited KingdomUnited StatesUpper middle incomeUruguayUzbekistanVanuatuVenezuela, RBVietnamWest Bank and GazaWorldYemen, Rep.ZambiaZimbabwe línea de tiempo (timeline):
En esta escala de tiempo se presenta un gráfico de 1971 y 2015 de Canada. Los datos de 1970 están ausentes. El número de observaciones reales por fecha: 45.
Fuente (nombre):
Indicadores del desarrollo mundial
Fuente (organización):
World Bank staff estimates based on Samuel Fankhauser's "Valuing Climate Change: The Economics of the Greenhouse" (1995).
Categorías:
Economy & Growth, Environment
Se ha actualizado:
23 abr 2017 año
Los indicadores de los cambios de valor en los últimos años
Mínimo:
0.268
1 ene 2012 año
Máximo:
0.532
1 ene 1999 año
A la fecha de observación
Valor
Cambio absoluto
El cambio con respecto al valor anterior
1 ene 1971 año
0.527
+0.527
0.0%
1 ene 1972 año
0.512
-0.015
-2.81%
1 ene 1973 año
0.512
+0.0
0.02%
1 ene 1974 año
0.472
-0.041
-7.96%
1 ene 1975 año
0.435
-0.036
-7.67%
1 ene 1976 año
0.453
+0.017
3.91%
1 ene 1977 año
0.41
-0.043
-9.44%
1 ene 1978 año
0.441
+0.031
7.56%
1 ene 1979 año
0.472
+0.032
7.19%
1 ene 1980 año
0.496
+0.024
4.98%
1 ene 1981 año
0.487
-0.009
-1.85%
1 ene 1982 año
0.47
-0.016
-3.38%
1 ene 1983 año
0.476
+0.006
1.22%
1 ene 1984 año
0.452
-0.024
-5.08%
1 ene 1985 año
0.475
+0.023
5.11%
1 ene 1986 año
0.479
+0.004
0.92%
1 ene 1987 año
0.46
-0.019
-3.98%
1 ene 1988 año
0.444
-0.016
-3.54%
1 ene 1989 año
0.417
-0.027
-5.99%
1 ene 1990 año
0.401
-0.016
-3.94%
1 ene 1991 año
0.377
-0.024
-6.01%
1 ene 1992 año
0.375
-0.002
-0.51%
1 ene 1993 año
0.414
+0.039
10.42%
1 ene 1994 año
0.445
+0.03
7.35%
1 ene 1995 año
0.471
+0.026
5.93%
1 ene 1996 año
0.475
+0.005
0.96%
1 ene 1997 año
0.482
+0.006
1.32%
1 ene 1998 año
0.491
+0.01
2.0%
1 ene 1999 año
0.532
+0.041
8.26%
1 ene 2000 año
0.521
-0.011
-2.09%
1 ene 2001 año
0.506
-0.015
-2.9%
1 ene 2002 año
0.523
+0.017
3.36%
1 ene 2003 año
0.513
-0.01
-1.89%
1 ene 2004 año
0.477
-0.035
-6.9%
1 ene 2005 año
0.431
-0.047
-9.8%
1 ene 2006 año
0.4
-0.03
-7.04%
1 ene 2007 año
0.36
-0.04
-10.02%
1 ene 2008 año
0.342
-0.018
-5.06%
1 ene 2009 año
0.323
-0.019
-5.48%
1 ene 2010 año
0.346
+0.023
7.12%
1 ene 2011 año
0.295
-0.052
-14.91%
1 ene 2012 año
0.268
-0.027
-9.04%
1 ene 2013 año
0.274
+0.006
2.24%
1 ene 2014 año
0.285
+0.011
3.95%
1 ene 2015 año
0.308
+0.024
8.32%
Ranking de los países por los datos estadísticos actuales


Comentarios: