29
/es/
es
AIzaSyAYiBZKx7MnpbEhh9jyipgxe19OcubqV5w
April 1, 2024
82137
Belgium
BEL
true
2
1
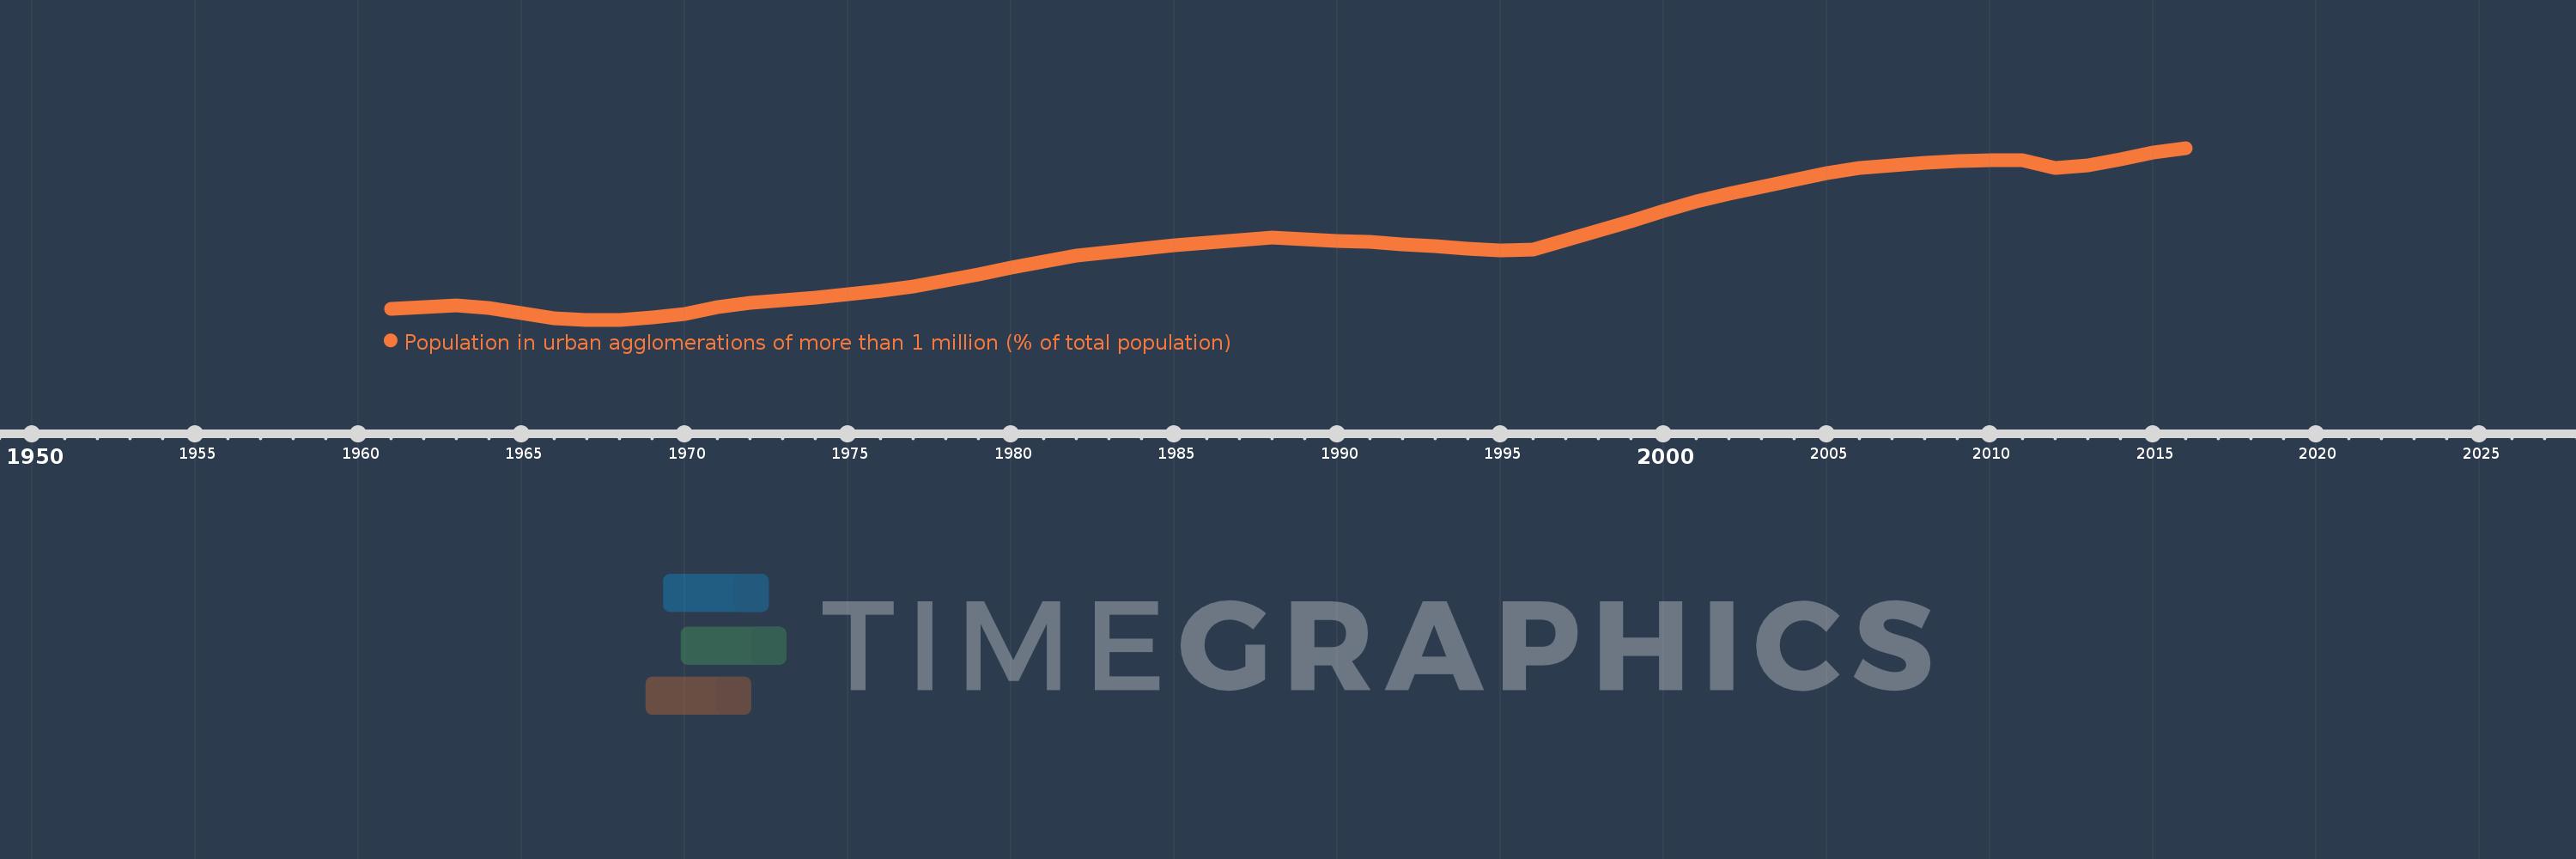
Population in urban agglomerations of more than 1 million (% of total population)
2016,2015,2014,2013,2012,2011,2010,2009,2008,2007,2006,2005,2004,2003,2002,2001,2000,1999,1998,1997,1996,1995,1994,1993,1992,1991,1990,1989,1988,1987,1986,1985,1984,1983,1982,1981,1980,1979,1978,1977,1976,1975,1974,1973,1972,1971,1970,1969,1968,1967,1966,1965,1964,1963,1962,1961
Estas estadísticas en otros países:
línea de tiempo (timeline):
En esta escala de tiempo se presenta un gráfico de 1961 y 2016 de Belgium. Los datos de 1960 están ausentes. El número de observaciones reales por fecha: 56.
Fuente (nombre):
Indicadores del desarrollo mundial
Fuente (organización):
United Nations, World Urbanization Prospects.
Categorías:
Climate Change, Urban Development
Se ha actualizado:
23 abr 2017 año
Los indicadores de los cambios de valor en los últimos años
Mínimo:
16.092
1 ene 1968 año
Máximo:
18.12
1 ene 2016 año
A la fecha de observación
Valor
Cambio absoluto
El cambio con respecto al valor anterior
1 ene 1961 año
16.22
+16.22
0.0%
1 ene 1962 año
16.244
+0.024
0.15%
1 ene 1963 año
16.264
+0.02
0.12%
1 ene 1964 año
16.232
-0.031
-0.19%
1 ene 1965 año
16.169
-0.063
-0.39%
1 ene 1966 año
16.112
-0.057
-0.35%
1 ene 1967 año
16.092
-0.019
-0.12%
1 ene 1968 año
16.092
0.0
0.0%
1 ene 1969 año
16.118
+0.026
0.16%
1 ene 1970 año
16.162
+0.044
0.27%
1 ene 1971 año
16.236
+0.074
0.46%
1 ene 1972 año
16.294
+0.059
0.36%
1 ene 1973 año
16.318
+0.023
0.14%
1 ene 1974 año
16.353
+0.036
0.22%
1 ene 1975 año
16.389
+0.036
0.22%
1 ene 1976 año
16.43
+0.04
0.25%
1 ene 1977 año
16.488
+0.059
0.36%
1 ene 1978 año
16.556
+0.068
0.41%
1 ene 1979 año
16.629
+0.073
0.44%
1 ene 1980 año
16.703
+0.074
0.44%
1 ene 1981 año
16.774
+0.071
0.43%
1 ene 1982 año
16.847
+0.073
0.43%
1 ene 1983 año
16.89
+0.043
0.26%
1 ene 1984 año
16.93
+0.04
0.24%
1 ene 1985 año
16.969
+0.039
0.23%
1 ene 1986 año
17.003
+0.034
0.2%
1 ene 1987 año
17.036
+0.033
0.19%
1 ene 1988 año
17.06
+0.024
0.14%
1 ene 1989 año
17.045
-0.015
-0.09%
1 ene 1990 año
17.022
-0.023
-0.13%
1 ene 1991 año
17.01
-0.012
-0.07%
1 ene 1992 año
16.986
-0.024
-0.14%
1 ene 1993 año
16.956
-0.03
-0.18%
1 ene 1994 año
16.929
-0.027
-0.16%
1 ene 1995 año
16.915
-0.013
-0.08%
1 ene 1996 año
16.918
+0.003
0.02%
1 ene 1997 año
17.035
+0.117
0.69%
1 ene 1998 año
17.145
+0.109
0.64%
1 ene 1999 año
17.26
+0.115
0.67%
1 ene 2000 año
17.374
+0.113
0.66%
1 ene 2001 año
17.486
+0.112
0.64%
1 ene 2002 año
17.58
+0.094
0.54%
1 ene 2003 año
17.657
+0.077
0.44%
1 ene 2004 año
17.739
+0.082
0.47%
1 ene 2005 año
17.82
+0.08
0.45%
1 ene 2006 año
17.879
+0.059
0.33%
1 ene 2007 año
17.919
+0.04
0.22%
1 ene 2008 año
17.946
+0.027
0.15%
1 ene 2009 año
17.963
+0.017
0.1%
1 ene 2010 año
17.977
+0.014
0.08%
1 ene 2011 año
17.972
-0.005
-0.03%
1 ene 2012 año
17.881
-0.09
-0.5%
1 ene 2013 año
17.91
+0.028
0.16%
1 ene 2014 año
17.981
+0.071
0.4%
1 ene 2015 año
18.063
+0.082
0.45%
1 ene 2016 año
18.12
+0.058
0.32%
Ranking de los países por los datos estadísticos actuales


Comentarios: