29
/es/
es
AIzaSyAYiBZKx7MnpbEhh9jyipgxe19OcubqV5w
April 1, 2024
236271
Senegal
SEN
true
2
1
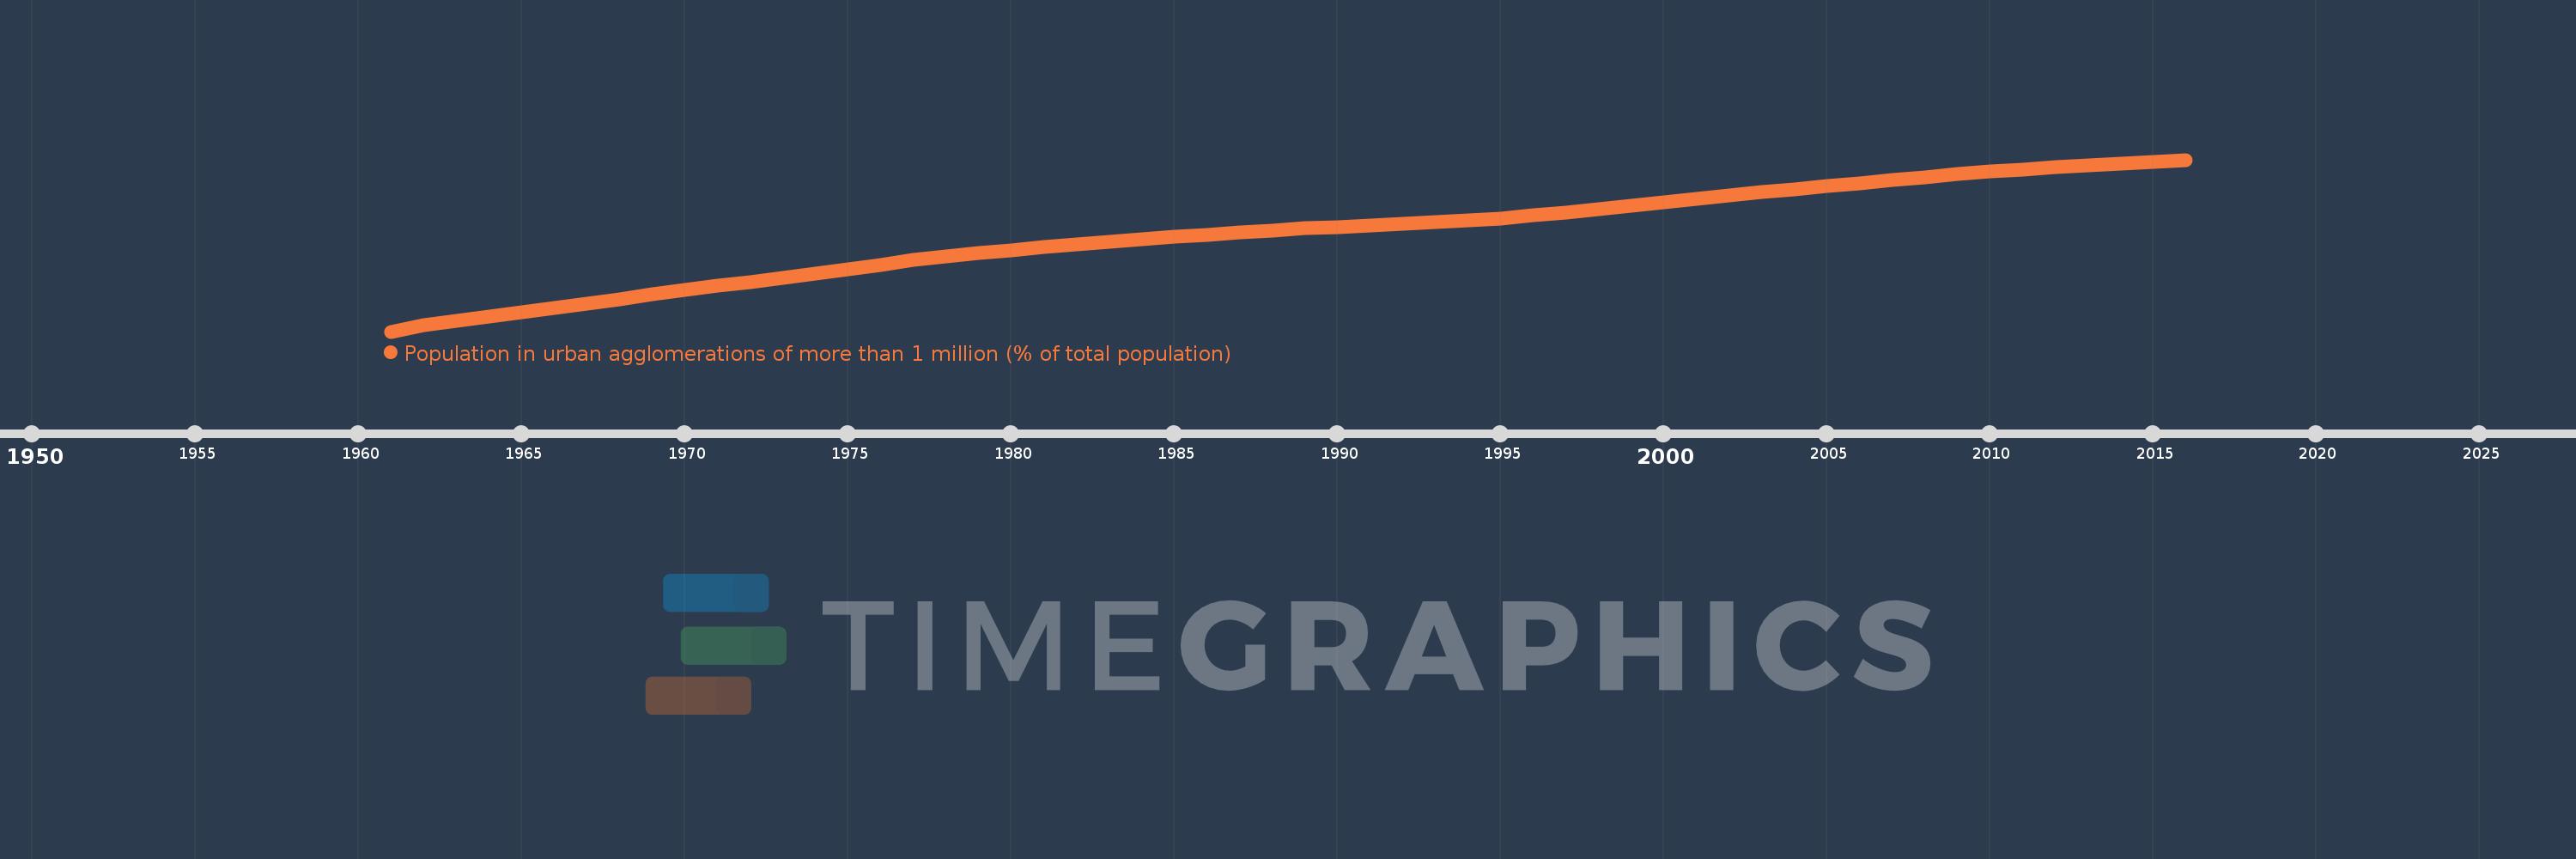
Population in urban agglomerations of more than 1 million (% of total population)
2016,2015,2014,2013,2012,2011,2010,2009,2008,2007,2006,2005,2004,2003,2002,2001,2000,1999,1998,1997,1996,1995,1994,1993,1992,1991,1990,1989,1988,1987,1986,1985,1984,1983,1982,1981,1980,1979,1978,1977,1976,1975,1974,1973,1972,1971,1970,1969,1968,1967,1966,1965,1964,1963,1962,1961
Estas estadísticas en otros países:
línea de tiempo (timeline):
En esta escala de tiempo se presenta un gráfico de 1961 y 2016 de Senegal. Los datos de 1960 están ausentes. El número de observaciones reales por fecha: 56.
Fuente (nombre):
Indicadores del desarrollo mundial
Fuente (organización):
United Nations, World Urbanization Prospects.
Categorías:
Climate Change, Urban Development
Se ha actualizado:
23 abr 2017 año
Los indicadores de los cambios de valor en los últimos años
Mínimo:
11.301
1 ene 1961 año
Máximo:
23.268
1 ene 2016 año
A la fecha de observación
Valor
Cambio absoluto
El cambio con respecto al valor anterior
1 ene 1961 año
11.301
+11.301
0.0%
1 ene 1962 año
11.772
+0.471
4.17%
1 ene 1963 año
12.06
+0.288
2.45%
1 ene 1964 año
12.353
+0.293
2.43%
1 ene 1965 año
12.651
+0.298
2.41%
1 ene 1966 año
12.95
+0.299
2.37%
1 ene 1967 año
13.255
+0.305
2.35%
1 ene 1968 año
13.565
+0.31
2.34%
1 ene 1969 año
13.88
+0.314
2.32%
1 ene 1970 año
14.192
+0.313
2.25%
1 ene 1971 año
14.474
+0.282
1.99%
1 ene 1972 año
14.752
+0.277
1.92%
1 ene 1973 año
15.029
+0.277
1.88%
1 ene 1974 año
15.312
+0.284
1.89%
1 ene 1975 año
15.619
+0.307
2.0%
1 ene 1976 año
15.957
+0.338
2.16%
1 ene 1977 año
16.294
+0.337
2.11%
1 ene 1978 año
16.516
+0.222
1.36%
1 ene 1979 año
16.749
+0.234
1.41%
1 ene 1980 año
16.978
+0.229
1.37%
1 ene 1981 año
17.193
+0.214
1.26%
1 ene 1982 año
17.388
+0.195
1.13%
1 ene 1983 año
17.57
+0.182
1.04%
1 ene 1984 año
17.739
+0.169
0.96%
1 ene 1985 año
17.899
+0.161
0.9%
1 ene 1986 año
18.051
+0.152
0.85%
1 ene 1987 año
18.199
+0.148
0.82%
1 ene 1988 año
18.342
+0.144
0.79%
1 ene 1989 año
18.482
+0.139
0.76%
1 ene 1990 año
18.586
+0.104
0.56%
1 ene 1991 año
18.694
+0.108
0.58%
1 ene 1992 año
18.805
+0.111
0.59%
1 ene 1993 año
18.921
+0.116
0.62%
1 ene 1994 año
19.048
+0.127
0.67%
1 ene 1995 año
19.199
+0.151
0.79%
1 ene 1996 año
19.379
+0.18
0.94%
1 ene 1997 año
19.591
+0.212
1.09%
1 ene 1998 año
19.826
+0.236
1.2%
1 ene 1999 año
20.078
+0.252
1.27%
1 ene 2000 año
20.33
+0.252
1.25%
1 ene 2001 año
20.572
+0.242
1.19%
1 ene 2002 año
20.798
+0.226
1.1%
1 ene 2003 año
21.013
+0.215
1.03%
1 ene 2004 año
21.22
+0.207
0.98%
1 ene 2005 año
21.424
+0.205
0.96%
1 ene 2006 año
21.63
+0.206
0.96%
1 ene 2007 año
21.84
+0.21
0.97%
1 ene 2008 año
22.05
+0.21
0.96%
1 ene 2009 año
22.254
+0.203
0.92%
1 ene 2010 año
22.441
+0.187
0.84%
1 ene 2011 año
22.607
+0.166
0.74%
1 ene 2012 año
22.75
+0.143
0.63%
1 ene 2013 año
22.877
+0.127
0.56%
1 ene 2014 año
22.997
+0.12
0.53%
1 ene 2015 año
23.124
+0.127
0.55%
1 ene 2016 año
23.268
+0.144
0.62%
Ranking de los países por los datos estadísticos actuales


Comentarios: