29
/es/
es
AIzaSyAYiBZKx7MnpbEhh9jyipgxe19OcubqV5w
April 1, 2024
176893
Lebanon
LBN
true
2
1
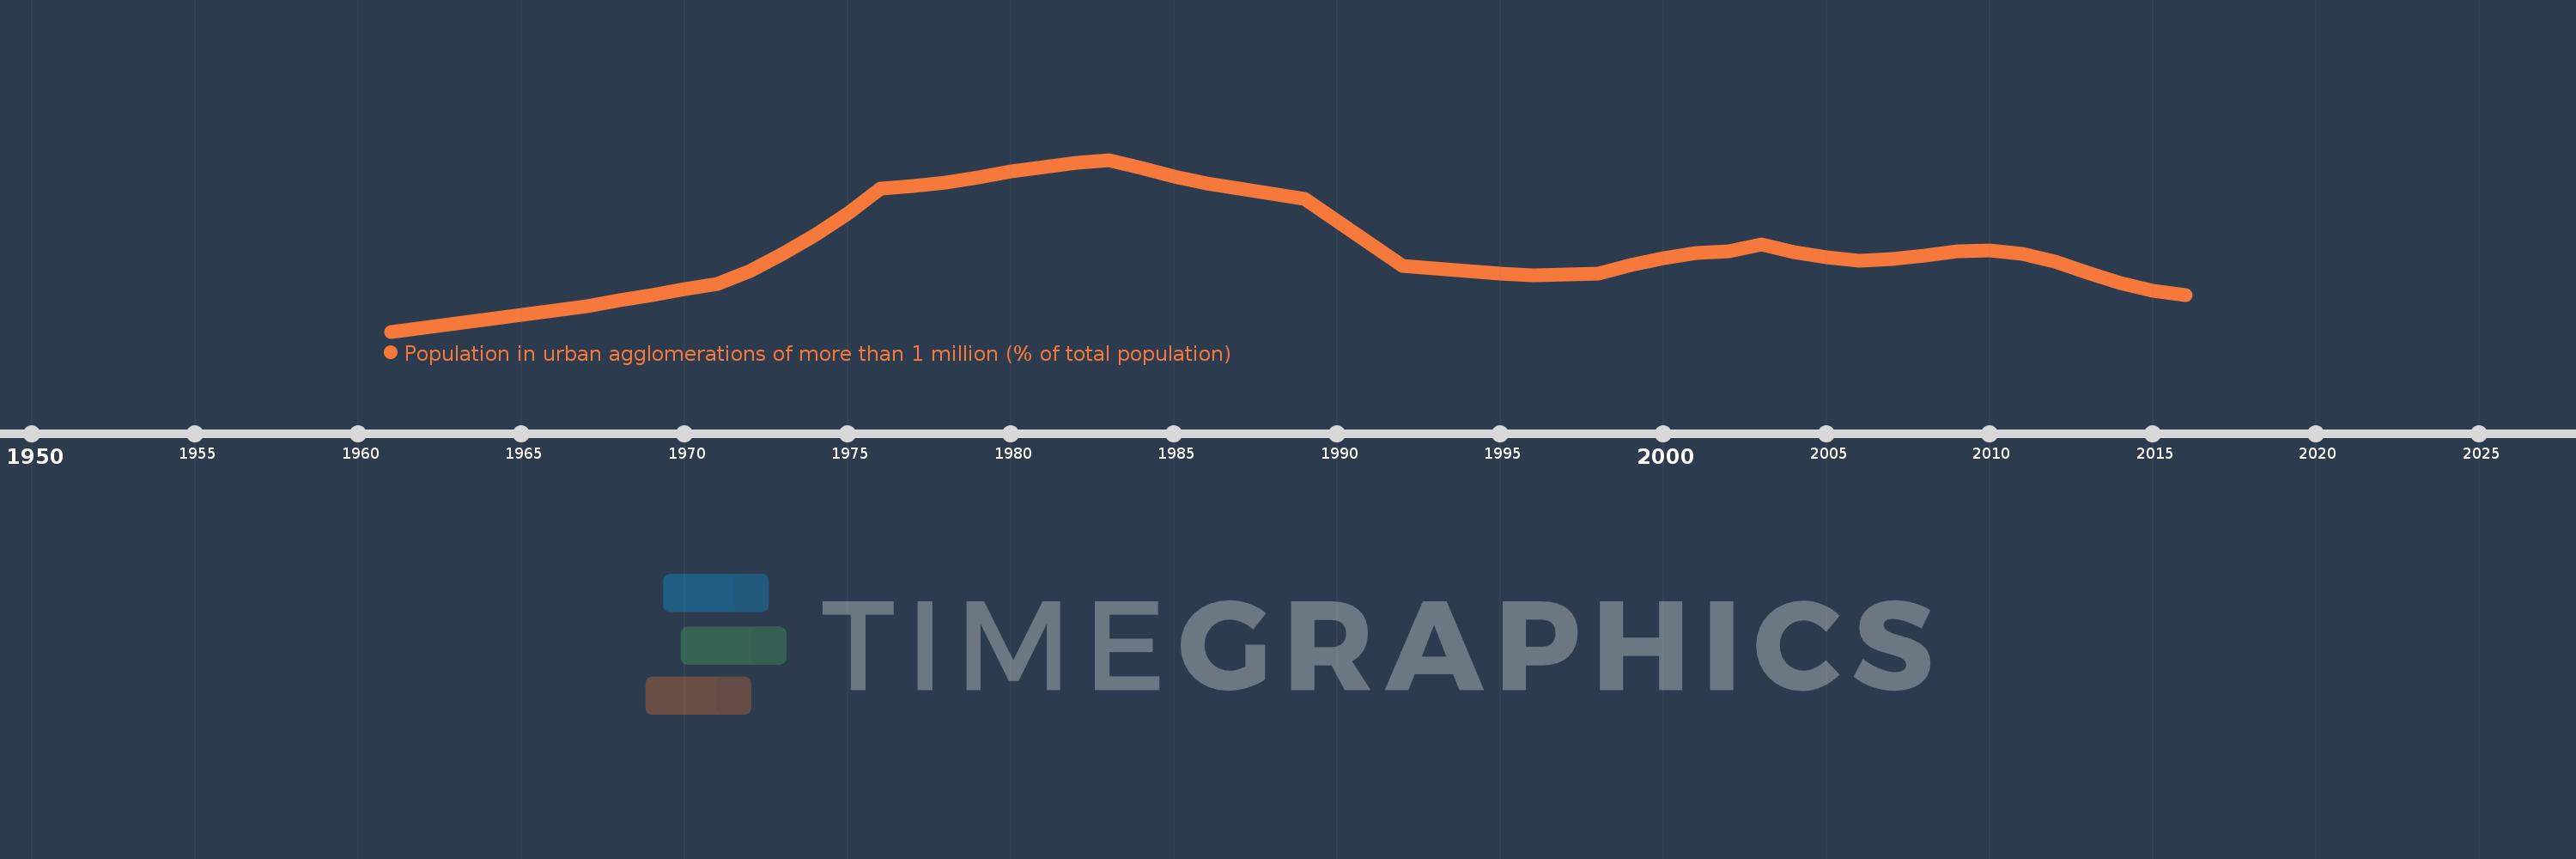
Population in urban agglomerations of more than 1 million (% of total population)
2016,2015,2014,2013,2012,2011,2010,2009,2008,2007,2006,2005,2004,2003,2002,2001,2000,1999,1998,1997,1996,1995,1994,1993,1992,1991,1990,1989,1988,1987,1986,1985,1984,1983,1982,1981,1980,1979,1978,1977,1976,1975,1974,1973,1972,1971,1970,1969,1968,1967,1966,1965,1964,1963,1962,1961
Estas estadísticas en otros países:
línea de tiempo (timeline):
En esta escala de tiempo se presenta un gráfico de 1961 y 2016 de Lebanon. Los datos de 1960 están ausentes. El número de observaciones reales por fecha: 56.
Fuente (nombre):
Indicadores del desarrollo mundial
Fuente (organización):
United Nations, World Urbanization Prospects.
Categorías:
Climate Change, Urban Development
Se ha actualizado:
23 abr 2017 año
Los indicadores de los cambios de valor en los últimos años
Mínimo:
31.076
1 ene 1961 año
Máximo:
63.633
1 ene 1983 año
A la fecha de observación
Valor
Cambio absoluto
El cambio con respecto al valor anterior
1 ene 1961 año
31.076
+31.076
0.0%
1 ene 1962 año
31.792
+0.716
2.3%
1 ene 1963 año
32.544
+0.751
2.36%
1 ene 1964 año
33.362
+0.819
2.52%
1 ene 1965 año
34.293
+0.931
2.79%
1 ene 1966 año
35.03
+0.737
2.15%
1 ene 1967 año
35.922
+0.891
2.54%
1 ene 1968 año
36.955
+1.033
2.88%
1 ene 1969 año
38.067
+1.113
3.01%
1 ene 1970 año
39.158
+1.09
2.86%
1 ene 1971 año
40.169
+1.011
2.58%
1 ene 1972 año
42.5
+2.331
5.8%
1 ene 1973 año
45.808
+3.308
7.78%
1 ene 1974 año
49.383
+3.575
7.8%
1 ene 1975 año
53.461
+4.077
8.26%
1 ene 1976 año
58.237
+4.776
8.93%
1 ene 1977 año
58.647
+0.41
0.7%
1 ene 1978 año
59.398
+0.751
1.28%
1 ene 1979 año
60.373
+0.975
1.64%
1 ene 1980 año
61.387
+1.014
1.68%
1 ene 1981 año
62.298
+0.912
1.49%
1 ene 1982 año
63.034
+0.735
1.18%
1 ene 1983 año
63.633
+0.599
0.95%
1 ene 1984 año
62.026
-1.607
-2.53%
1 ene 1985 año
60.53
-1.495
-2.41%
1 ene 1986 año
59.221
-1.309
-2.16%
1 ene 1987 año
58.127
-1.094
-1.85%
1 ene 1988 año
57.177
-0.95
-1.63%
1 ene 1989 año
56.209
-0.968
-1.69%
1 ene 1990 año
52.024
-4.186
-7.45%
1 ene 1991 año
47.818
-4.206
-8.08%
1 ene 1992 año
43.599
-4.219
-8.82%
1 ene 1993 año
43.115
-0.483
-1.11%
1 ene 1994 año
42.52
-0.595
-1.38%
1 ene 1995 año
42.039
-0.482
-1.13%
1 ene 1996 año
41.794
-0.244
-0.58%
1 ene 1997 año
41.854
+0.06
0.14%
1 ene 1998 año
42.134
+0.28
0.67%
1 ene 1999 año
43.674
+1.54
3.66%
1 ene 2000 año
45.044
+1.37
3.14%
1 ene 2001 año
45.951
+0.907
2.01%
1 ene 2002 año
46.259
+0.308
0.67%
1 ene 2003 año
47.626
+1.367
2.96%
1 ene 2004 año
46.207
-1.419
-2.98%
1 ene 2005 año
45.132
-1.075
-2.33%
1 ene 2006 año
44.58
-0.552
-1.22%
1 ene 2007 año
44.811
+0.231
0.52%
1 ene 2008 año
45.519
+0.707
1.58%
1 ene 2009 año
46.289
+0.77
1.69%
1 ene 2010 año
46.529
+0.24
0.52%
1 ene 2011 año
45.889
-0.64
-1.38%
1 ene 2012 año
44.337
-1.552
-3.38%
1 ene 2013 año
42.289
-2.048
-4.62%
1 ene 2014 año
40.289
-2.0
-4.73%
1 ene 2015 año
38.824
-1.465
-3.64%
1 ene 2016 año
38.055
-0.769
-1.98%
Ranking de los países por los datos estadísticos actuales


Comentarios: