29
/es/
es
AIzaSyAYiBZKx7MnpbEhh9jyipgxe19OcubqV5w
April 1, 2024
74296
Austria
AUT
true
2
1
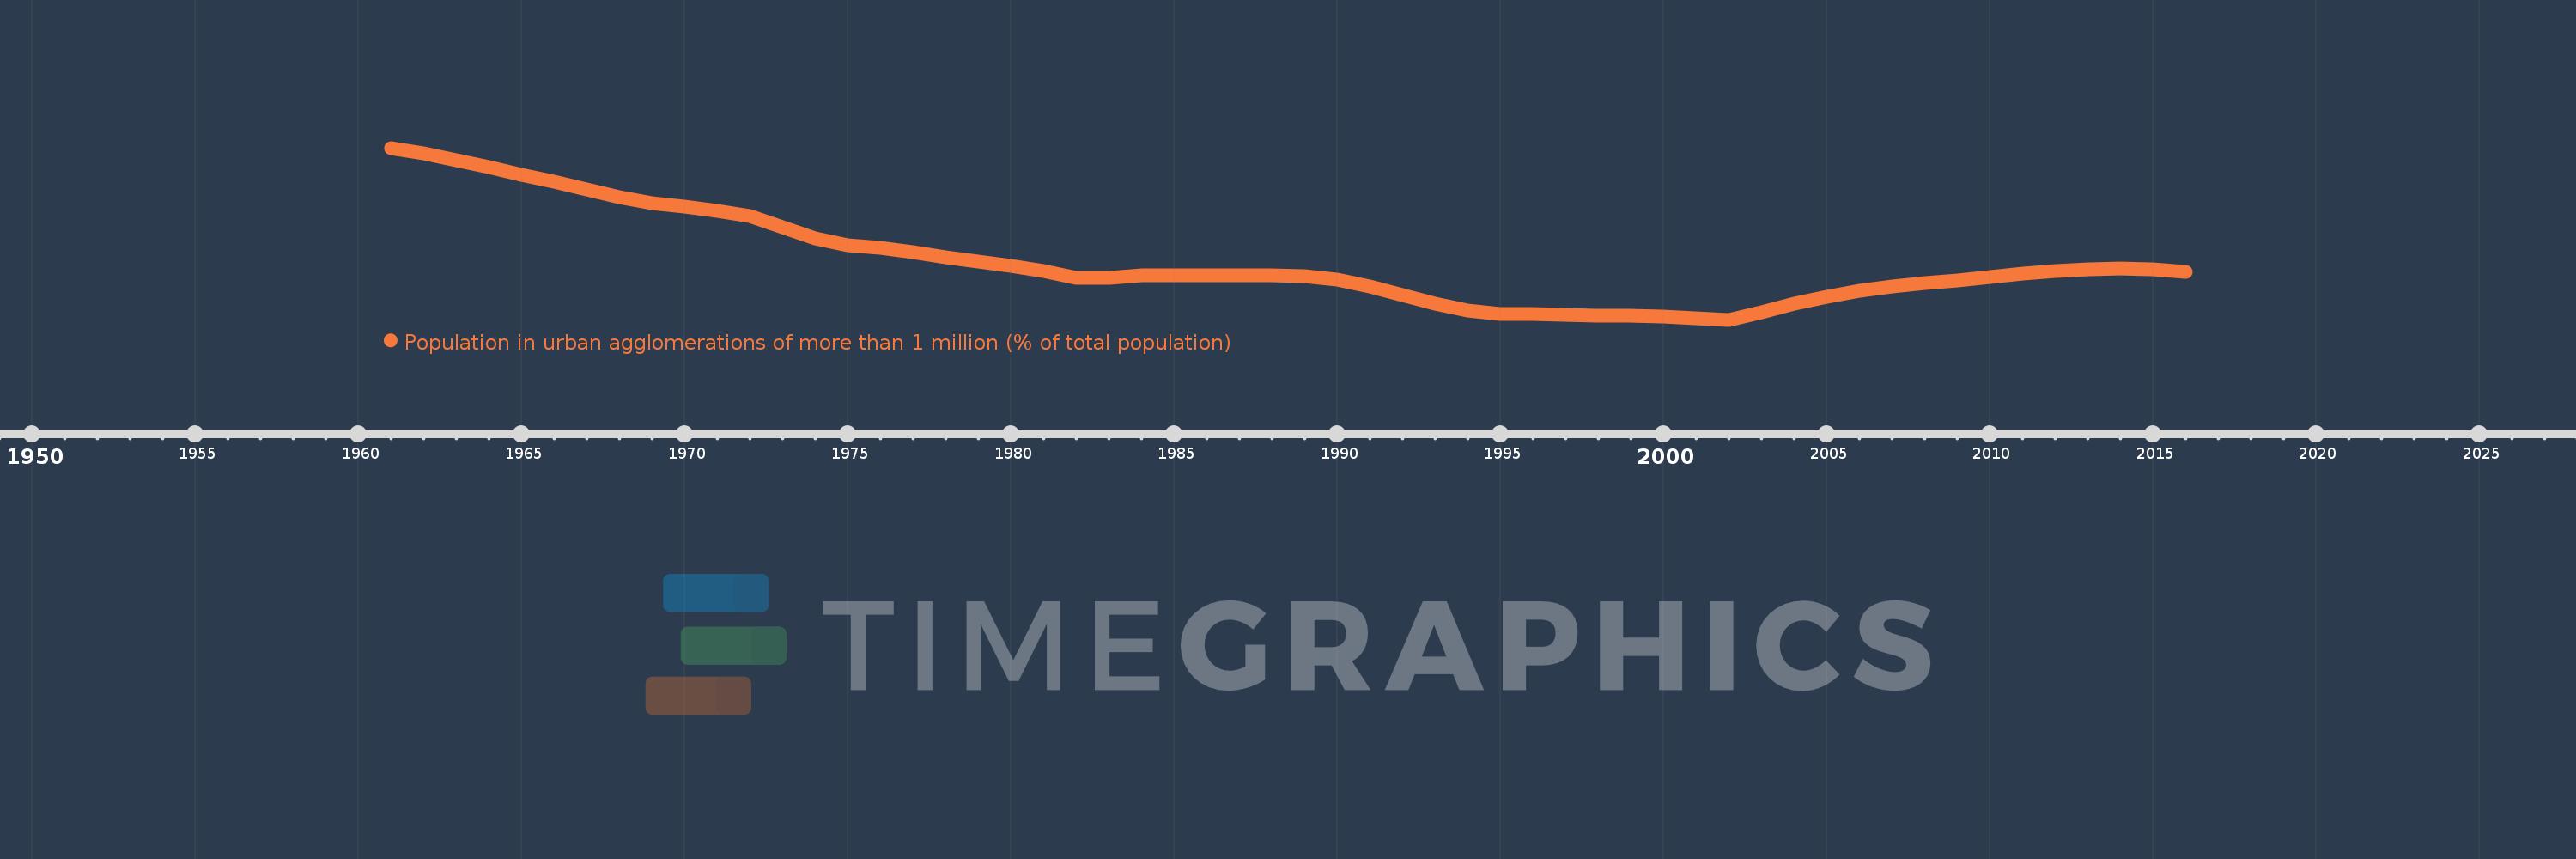
Population in urban agglomerations of more than 1 million (% of total population)
2016,2015,2014,2013,2012,2011,2010,2009,2008,2007,2006,2005,2004,2003,2002,2001,2000,1999,1998,1997,1996,1995,1994,1993,1992,1991,1990,1989,1988,1987,1986,1985,1984,1983,1982,1981,1980,1979,1978,1977,1976,1975,1974,1973,1972,1971,1970,1969,1968,1967,1966,1965,1964,1963,1962,1961
Estas estadísticas en otros países:
línea de tiempo (timeline):
En esta escala de tiempo se presenta un gráfico de 1961 y 2016 de Austria. Los datos de 1960 están ausentes. El número de observaciones reales por fecha: 56.
Fuente (nombre):
Indicadores del desarrollo mundial
Fuente (organización):
United Nations, World Urbanization Prospects.
Categorías:
Climate Change, Urban Development
Se ha actualizado:
23 abr 2017 año
Los indicadores de los cambios de valor en los últimos años
Mínimo:
19.309
1 ene 2002 año
Máximo:
23.082
1 ene 1961 año
A la fecha de observación
Valor
Cambio absoluto
El cambio con respecto al valor anterior
1 ene 1961 año
23.082
+23.082
0.0%
1 ene 1962 año
22.965
-0.117
-0.51%
1 ene 1963 año
22.814
-0.151
-0.66%
1 ene 1964 año
22.657
-0.157
-0.69%
1 ene 1965 año
22.496
-0.161
-0.71%
1 ene 1966 año
22.34
-0.156
-0.69%
1 ene 1967 año
22.174
-0.166
-0.75%
1 ene 1968 año
21.998
-0.175
-0.79%
1 ene 1969 año
21.874
-0.124
-0.56%
1 ene 1970 año
21.788
-0.086
-0.39%
1 ene 1971 año
21.702
-0.086
-0.4%
1 ene 1972 año
21.58
-0.122
-0.56%
1 ene 1973 año
21.335
-0.245
-1.14%
1 ene 1974 año
21.098
-0.237
-1.11%
1 ene 1975 año
20.944
-0.154
-0.73%
1 ene 1976 año
20.882
-0.062
-0.3%
1 ene 1977 año
20.802
-0.08
-0.39%
1 ene 1978 año
20.677
-0.124
-0.6%
1 ene 1979 año
20.578
-0.099
-0.48%
1 ene 1980 año
20.498
-0.08
-0.39%
1 ene 1981 año
20.383
-0.115
-0.56%
1 ene 1982 año
20.234
-0.149
-0.73%
1 ene 1983 año
20.231
-0.003
-0.02%
1 ene 1984 año
20.275
+0.044
0.22%
1 ene 1985 año
20.287
+0.013
0.06%
1 ene 1986 año
20.289
+0.002
0.01%
1 ene 1987 año
20.287
-0.002
-0.01%
1 ene 1988 año
20.286
-0.002
-0.01%
1 ene 1989 año
20.268
-0.017
-0.09%
1 ene 1990 año
20.188
-0.08
-0.39%
1 ene 1991 año
20.046
-0.142
-0.7%
1 ene 1992 año
19.858
-0.188
-0.94%
1 ene 1993 año
19.654
-0.204
-1.03%
1 ene 1994 año
19.505
-0.148
-0.76%
1 ene 1995 año
19.443
-0.062
-0.32%
1 ene 1996 año
19.427
-0.017
-0.09%
1 ene 1997 año
19.413
-0.013
-0.07%
1 ene 1998 año
19.404
-0.009
-0.05%
1 ene 1999 año
19.396
-0.008
-0.04%
1 ene 2000 año
19.371
-0.025
-0.13%
1 ene 2001 año
19.337
-0.034
-0.17%
1 ene 2002 año
19.309
-0.028
-0.15%
1 ene 2003 año
19.481
+0.172
0.89%
1 ene 2004 año
19.656
+0.175
0.9%
1 ene 2005 año
19.806
+0.15
0.76%
1 ene 2006 año
19.944
+0.138
0.7%
1 ene 2007 año
20.047
+0.103
0.51%
1 ene 2008 año
20.108
+0.061
0.31%
1 ene 2009 año
20.172
+0.064
0.32%
1 ene 2010 año
20.246
+0.074
0.37%
1 ene 2011 año
20.325
+0.079
0.39%
1 ene 2012 año
20.385
+0.06
0.29%
1 ene 2013 año
20.42
+0.036
0.17%
1 ene 2014 año
20.43
+0.009
0.05%
1 ene 2015 año
20.409
-0.021
-0.1%
1 ene 2016 año
20.356
-0.054
-0.26%
Ranking de los países por los datos estadísticos actuales


Comentarios: