29
/es/
es
AIzaSyAYiBZKx7MnpbEhh9jyipgxe19OcubqV5w
April 1, 2024
47543
Lower middle income
LMC
false
2
1
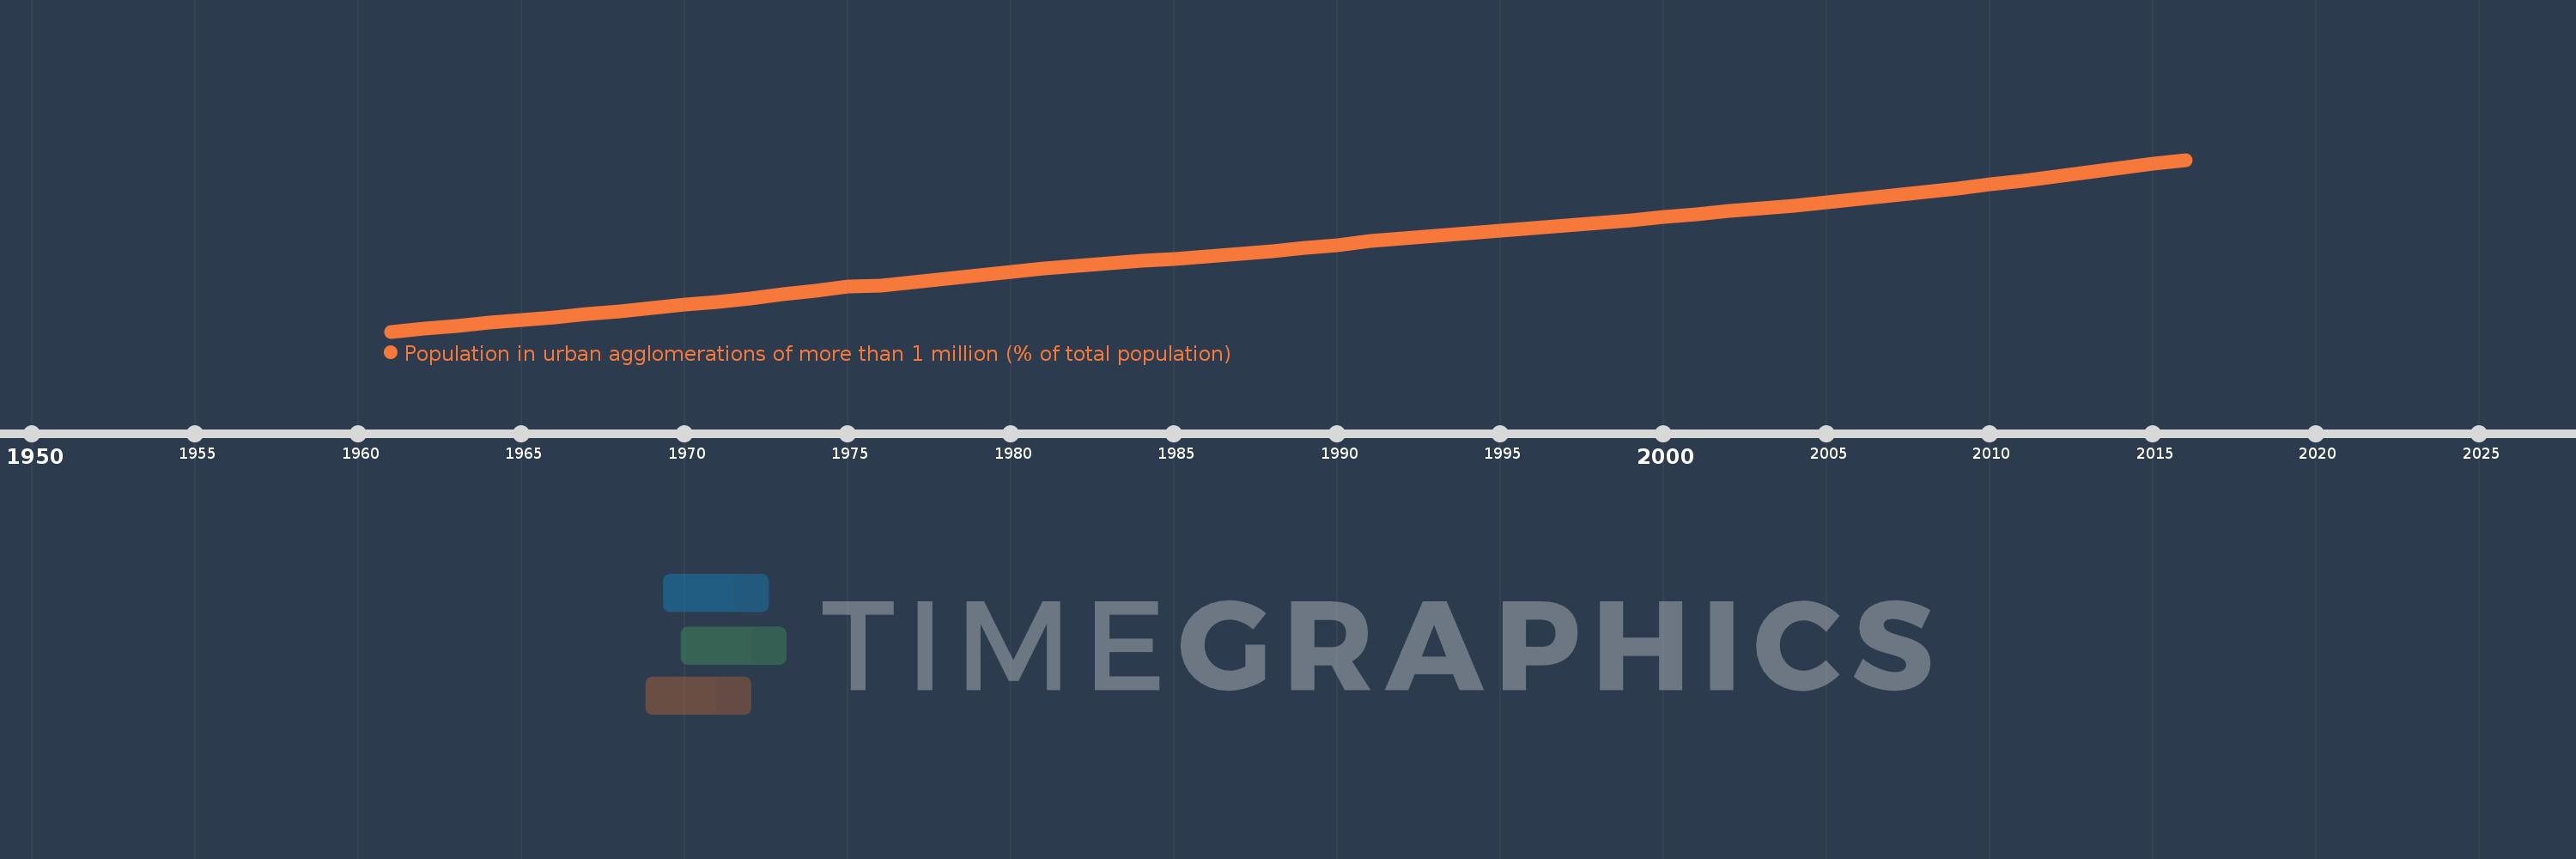
Population in urban agglomerations of more than 1 million (% of total population)
2016,2015,2014,2013,2012,2011,2010,2009,2008,2007,2006,2005,2004,2003,2002,2001,2000,1999,1998,1997,1996,1995,1994,1993,1992,1991,1990,1989,1988,1987,1986,1985,1984,1983,1982,1981,1980,1979,1978,1977,1976,1975,1974,1973,1972,1971,1970,1969,1968,1967,1966,1965,1964,1963,1962,1961
Estas estadísticas en otros países:
línea de tiempo (timeline):
En esta escala de tiempo se presenta un gráfico de 1961 y 2016 de Lower middle income. Los datos de 1960 están ausentes. El número de observaciones reales por fecha: 56.
Fuente (nombre):
Indicadores del desarrollo mundial
Fuente (organización):
United Nations, World Urbanization Prospects.
Categorías:
Climate Change, Urban Development
Se ha actualizado:
23 abr 2017 año
Los indicadores de los cambios de valor en los últimos años
Mínimo:
7.703
1 ene 1961 año
Máximo:
15.599
1 ene 2016 año
A la fecha de observación
Valor
Cambio absoluto
El cambio con respecto al valor anterior
1 ene 1961 año
7.703
+7.703
0.0%
1 ene 1962 año
7.838
+0.135
1.75%
1 ene 1963 año
7.973
+0.136
1.73%
1 ene 1964 año
8.106
+0.133
1.67%
1 ene 1965 año
8.238
+0.132
1.63%
1 ene 1966 año
8.371
+0.132
1.6%
1 ene 1967 año
8.506
+0.135
1.62%
1 ene 1968 año
8.641
+0.135
1.59%
1 ene 1969 año
8.782
+0.141
1.63%
1 ene 1970 año
8.927
+0.145
1.65%
1 ene 1971 año
9.075
+0.148
1.66%
1 ene 1972 año
9.235
+0.16
1.76%
1 ene 1973 año
9.412
+0.177
1.92%
1 ene 1974 año
9.594
+0.182
1.94%
1 ene 1975 año
9.78
+0.186
1.94%
1 ene 1976 año
9.809
+0.029
0.3%
1 ene 1977 año
9.965
+0.156
1.59%
1 ene 1978 año
10.121
+0.156
1.57%
1 ene 1979 año
10.281
+0.16
1.58%
1 ene 1980 año
10.438
+0.157
1.52%
1 ene 1981 año
10.598
+0.16
1.54%
1 ene 1982 año
10.735
+0.136
1.29%
1 ene 1983 año
10.837
+0.103
0.96%
1 ene 1984 año
10.943
+0.106
0.98%
1 ene 1985 año
11.048
+0.105
0.96%
1 ene 1986 año
11.159
+0.11
1.0%
1 ene 1987 año
11.277
+0.118
1.06%
1 ene 1988 año
11.405
+0.129
1.14%
1 ene 1989 año
11.544
+0.139
1.22%
1 ene 1990 año
11.69
+0.146
1.26%
1 ene 1991 año
11.851
+0.161
1.38%
1 ene 1992 año
11.995
+0.143
1.21%
1 ene 1993 año
12.105
+0.111
0.92%
1 ene 1994 año
12.219
+0.114
0.94%
1 ene 1995 año
12.338
+0.119
0.98%
1 ene 1996 año
12.462
+0.124
1.01%
1 ene 1997 año
12.583
+0.121
0.97%
1 ene 1998 año
12.705
+0.122
0.97%
1 ene 1999 año
12.832
+0.127
1.0%
1 ene 2000 año
12.966
+0.134
1.04%
1 ene 2001 año
13.109
+0.143
1.11%
1 ene 2002 año
13.25
+0.14
1.07%
1 ene 2003 año
13.372
+0.122
0.92%
1 ene 2004 año
13.501
+0.129
0.97%
1 ene 2005 año
13.638
+0.136
1.01%
1 ene 2006 año
13.783
+0.145
1.06%
1 ene 2007 año
13.968
+0.185
1.34%
1 ene 2008 año
14.124
+0.156
1.12%
1 ene 2009 año
14.288
+0.164
1.16%
1 ene 2010 año
14.459
+0.17
1.19%
1 ene 2011 año
14.635
+0.177
1.22%
1 ene 2012 año
14.819
+0.184
1.26%
1 ene 2013 año
15.013
+0.194
1.31%
1 ene 2014 año
15.215
+0.201
1.34%
1 ene 2015 año
15.424
+0.209
1.38%
1 ene 2016 año
15.599
+0.175
1.13%
Ranking de los países por los datos estadísticos actuales


Comentarios: