29
/es/
es
AIzaSyAYiBZKx7MnpbEhh9jyipgxe19OcubqV5w
April 1, 2024
26824
Early-demographic dividend
EAR
false
2
1
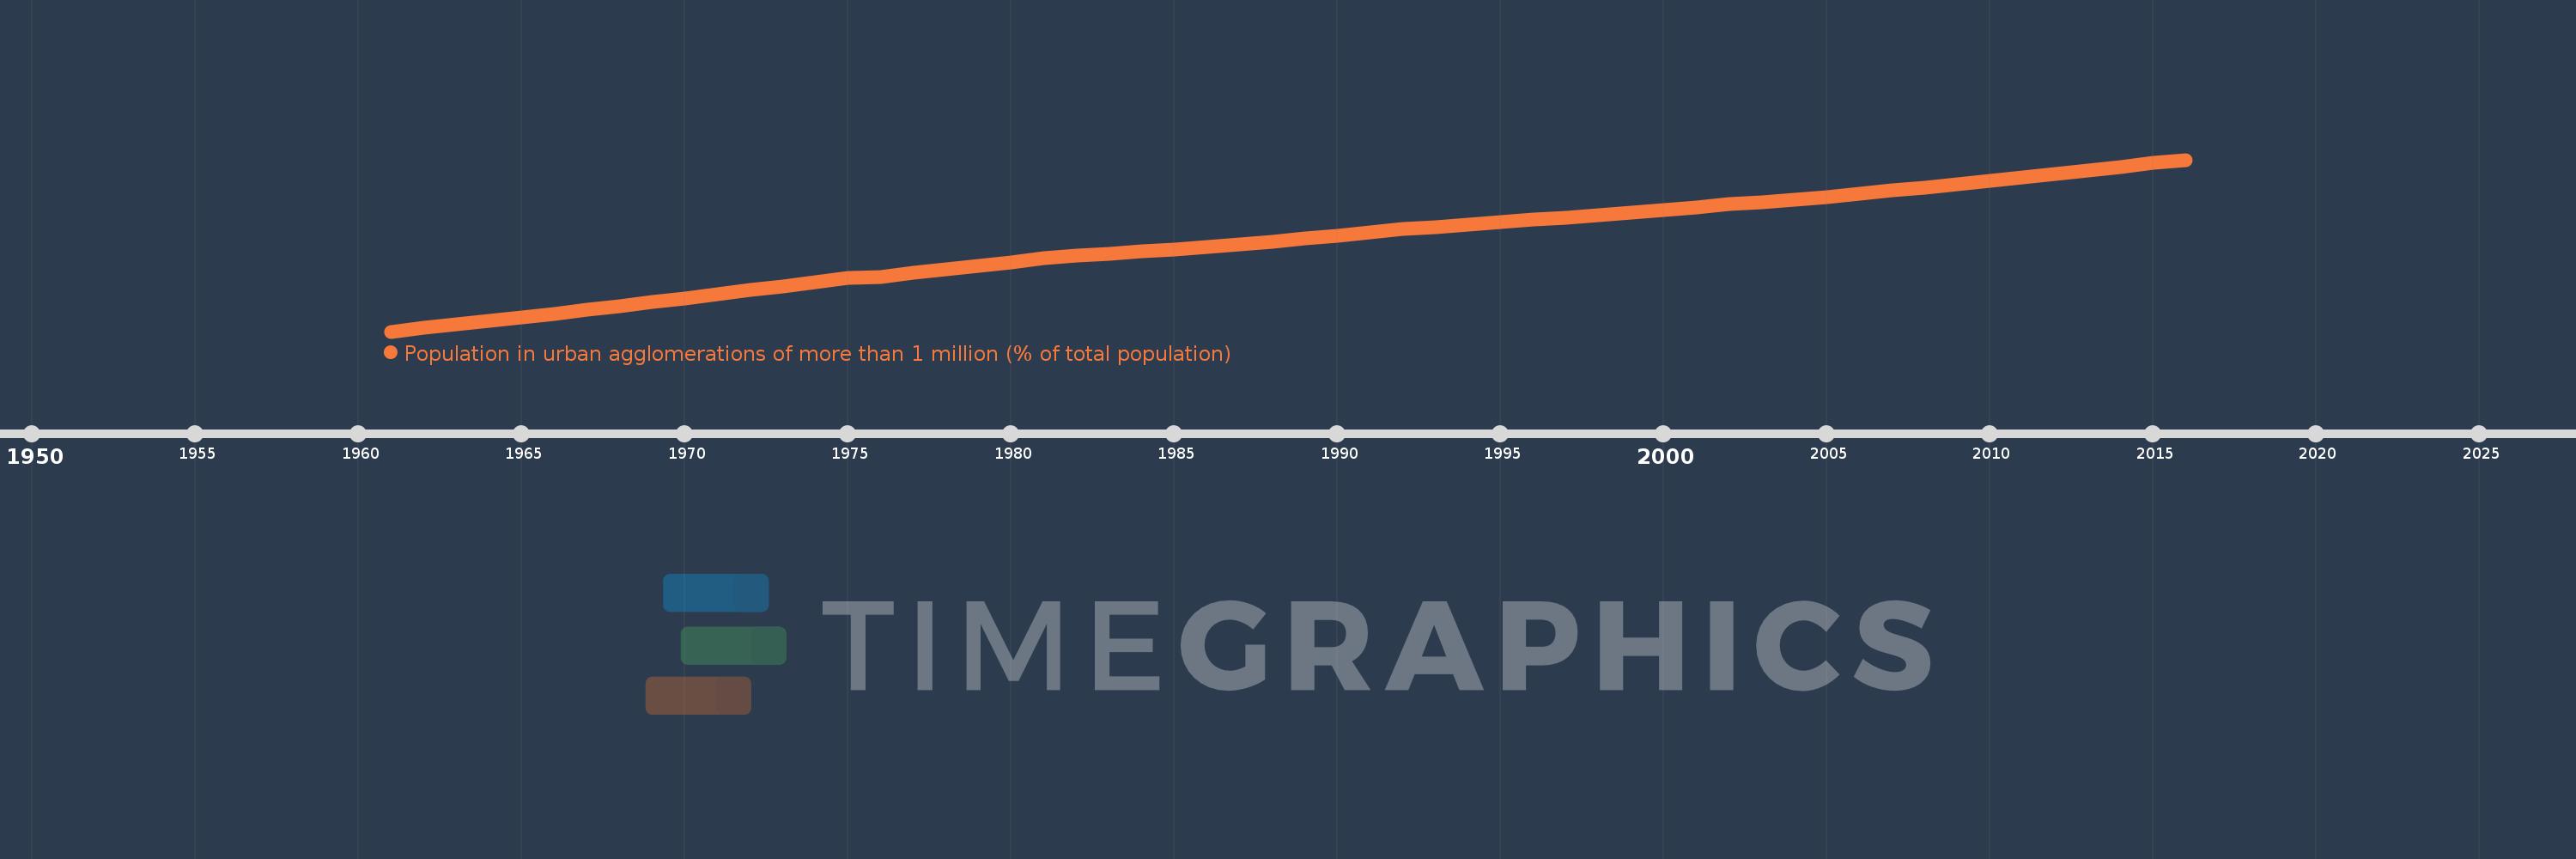
Population in urban agglomerations of more than 1 million (% of total population)
2016,2015,2014,2013,2012,2011,2010,2009,2008,2007,2006,2005,2004,2003,2002,2001,2000,1999,1998,1997,1996,1995,1994,1993,1992,1991,1990,1989,1988,1987,1986,1985,1984,1983,1982,1981,1980,1979,1978,1977,1976,1975,1974,1973,1972,1971,1970,1969,1968,1967,1966,1965,1964,1963,1962,1961
Estas estadísticas en otros países:
línea de tiempo (timeline):
En esta escala de tiempo se presenta un gráfico de 1961 y 2016 de Early-demographic dividend. Los datos de 1960 están ausentes. El número de observaciones reales por fecha: 56.
Fuente (nombre):
Indicadores del desarrollo mundial
Fuente (organización):
United Nations, World Urbanization Prospects.
Categorías:
Climate Change, Urban Development
Se ha actualizado:
23 abr 2017 año
Los indicadores de los cambios de valor en los últimos años
Mínimo:
10.147
1 ene 1961 año
Máximo:
18.31
1 ene 2016 año
A la fecha de observación
Valor
Cambio absoluto
El cambio con respecto al valor anterior
1 ene 1961 año
10.147
+10.147
0.0%
1 ene 1962 año
10.315
+0.168
1.65%
1 ene 1963 año
10.481
+0.166
1.61%
1 ene 1964 año
10.649
+0.168
1.6%
1 ene 1965 año
10.824
+0.174
1.64%
1 ene 1966 año
11.002
+0.178
1.64%
1 ene 1967 año
11.18
+0.179
1.63%
1 ene 1968 año
11.356
+0.176
1.57%
1 ene 1969 año
11.54
+0.184
1.62%
1 ene 1970 año
11.729
+0.189
1.64%
1 ene 1971 año
11.921
+0.192
1.64%
1 ene 1972 año
12.107
+0.187
1.57%
1 ene 1973 año
12.304
+0.196
1.62%
1 ene 1974 año
12.5
+0.196
1.59%
1 ene 1975 año
12.699
+0.199
1.59%
1 ene 1976 año
12.751
+0.052
0.41%
1 ene 1977 año
12.923
+0.172
1.35%
1 ene 1978 año
13.094
+0.171
1.33%
1 ene 1979 año
13.267
+0.173
1.32%
1 ene 1980 año
13.441
+0.174
1.31%
1 ene 1981 año
13.622
+0.181
1.35%
1 ene 1982 año
13.76
+0.137
1.01%
1 ene 1983 año
13.856
+0.096
0.7%
1 ene 1984 año
13.953
+0.098
0.7%
1 ene 1985 año
14.059
+0.105
0.76%
1 ene 1986 año
14.173
+0.114
0.81%
1 ene 1987 año
14.299
+0.126
0.89%
1 ene 1988 año
14.425
+0.126
0.88%
1 ene 1989 año
14.562
+0.138
0.95%
1 ene 1990 año
14.713
+0.15
1.03%
1 ene 1991 año
14.875
+0.162
1.1%
1 ene 1992 año
15.011
+0.136
0.92%
1 ene 1993 año
15.122
+0.111
0.74%
1 ene 1994 año
15.228
+0.106
0.7%
1 ene 1995 año
15.341
+0.113
0.74%
1 ene 1996 año
15.46
+0.119
0.77%
1 ene 1997 año
15.572
+0.112
0.73%
1 ene 1998 año
15.684
+0.112
0.72%
1 ene 1999 año
15.801
+0.117
0.75%
1 ene 2000 año
15.926
+0.125
0.79%
1 ene 2001 año
16.059
+0.133
0.84%
1 ene 2002 año
16.189
+0.13
0.81%
1 ene 2003 año
16.304
+0.115
0.71%
1 ene 2004 año
16.42
+0.117
0.72%
1 ene 2005 año
16.544
+0.124
0.75%
1 ene 2006 año
16.678
+0.134
0.81%
1 ene 2007 año
16.851
+0.172
1.03%
1 ene 2008 año
16.998
+0.147
0.87%
1 ene 2009 año
17.152
+0.154
0.91%
1 ene 2010 año
17.313
+0.161
0.94%
1 ene 2011 año
17.457
+0.145
0.84%
1 ene 2012 año
17.627
+0.17
0.97%
1 ene 2013 año
17.802
+0.175
0.99%
1 ene 2014 año
17.983
+0.18
1.01%
1 ene 2015 año
18.171
+0.188
1.05%
1 ene 2016 año
18.31
+0.139
0.76%
Ranking de los países por los datos estadísticos actuales


Comentarios: