29
/es/
es
AIzaSyAYiBZKx7MnpbEhh9jyipgxe19OcubqV5w
April 1, 2024
81477
Belgium
BEL
true
2
1
Agricultural raw materials imports (% of merchandise imports)
2016,2015,2014,2013,2012,2011,2010,2009,2008,2007,2006,2005,2004,2003,2002,2001,2000,1999,1998,1997,1996,1995,1994,1993,1992,1991,1990,1989,1988,1987,1986,1985,1984,1983,1982,1981,1980,1979,1978,1977,1976,1975,1974,1973,1972,1971,1970,1969,1968,1967,1966,1965,1964,1963
Estas estadísticas en otros países:
AfghanistanAlbaniaAlgeriaAndorraAngolaAntigua and BarbudaArab WorldArgentinaArmeniaArubaAustraliaAustriaAzerbaijanBahamas, TheBahrainBangladeshBarbadosBelarusBelgiumBelizeBeninBermudaBhutanBoliviaBosnia and HerzegovinaBotswanaBrazilBrunei DarussalamBulgariaBurkina FasoBurundiCabo VerdeCambodiaCameroonCanadaCaribbean small statesCayman IslandsCentral African RepublicCentral Europe and the BalticsChadChileChinaColombiaComorosCongo, Dem. Rep.Congo, Rep.Costa RicaCote d'IvoireCroatiaCubaCyprusCzech RepublicDenmarkDjiboutiDominicaDominican RepublicEarly-demographic dividendEast Asia & PacificEast Asia & Pacific (excluding high income)East Asia & Pacific (IDA & IBRD countries)EcuadorEgypt, Arab Rep.El SalvadorEquatorial GuineaEritreaEstoniaEthiopiaEuro areaEurope & Central AsiaEurope & Central Asia (excluding high income)Europe & Central Asia (IDA & IBRD countries)European UnionFaroe IslandsFijiFinlandFragile and conflict affected situationsFranceFrench PolynesiaGabonGambia, TheGeorgiaGermanyGhanaGreeceGreenlandGrenadaGuatemalaGuineaGuinea-BissauGuyanaHaitiHeavily indebted poor countries (HIPC)High incomeHondurasHong Kong SAR, ChinaHungaryIBRD onlyIcelandIDA & IBRD totalIDA blendIDA onlyIDA totalIndiaIndonesiaIran, Islamic Rep.IraqIrelandIsraelItalyJamaicaJapanJordanKazakhstanKenyaKiribatiKorea, Rep.KuwaitKyrgyz RepublicLao PDRLate-demographic dividendLatin America & Caribbean Latin America & Caribbean (excluding high income)Latin America & the Caribbean (IDA & IBRD countries)LatviaLeast developed countries: UN classificationLebanonLesothoLiberiaLibyaLithuaniaLow & middle incomeLow incomeLower middle incomeLuxembourgMacao SAR, ChinaMacedonia, FYRMadagascarMalawiMalaysiaMaldivesMaliMaltaMauritaniaMauritiusMexicoMiddle East & North AfricaMiddle East & North Africa (excluding high income)Middle East & North Africa (IDA & IBRD countries)Middle incomeMoldovaMongoliaMoroccoMozambiqueMyanmarNamibiaNepalNetherlandsNew CaledoniaNew ZealandNicaraguaNigerNigeriaNorth AmericaNorwayOECD membersOmanOther small statesPacific island small statesPakistanPalauPanamaPapua New GuineaParaguayPeruPhilippinesPolandPortugalPost-demographic dividendPre-demographic dividendQatarRomaniaRussian FederationRwandaSamoaSao Tome and PrincipeSaudi ArabiaSenegalSerbiaSeychellesSierra LeoneSingaporeSlovak RepublicSloveniaSmall statesSolomon IslandsSomaliaSouth AfricaSouth AsiaSouth Asia (IDA & IBRD)SpainSri LankaSt. Kitts and NevisSt. LuciaSt. Vincent and the GrenadinesSub-Saharan Africa Sub-Saharan Africa (excluding high income)Sub-Saharan Africa (IDA & IBRD countries)SudanSurinameSwazilandSwedenSwitzerlandSyrian Arab RepublicTajikistanTanzaniaThailandTimor-LesteTogoTongaTrinidad and TobagoTunisiaTurkeyTurkmenistanTurks and Caicos IslandsTuvaluUgandaUkraineUnited Arab EmiratesUnited KingdomUnited StatesUpper middle incomeUruguayVanuatuVenezuela, RBVietnamVirgin Islands (U.S.)WorldYemen, Rep.ZambiaZimbabwe línea de tiempo (timeline):
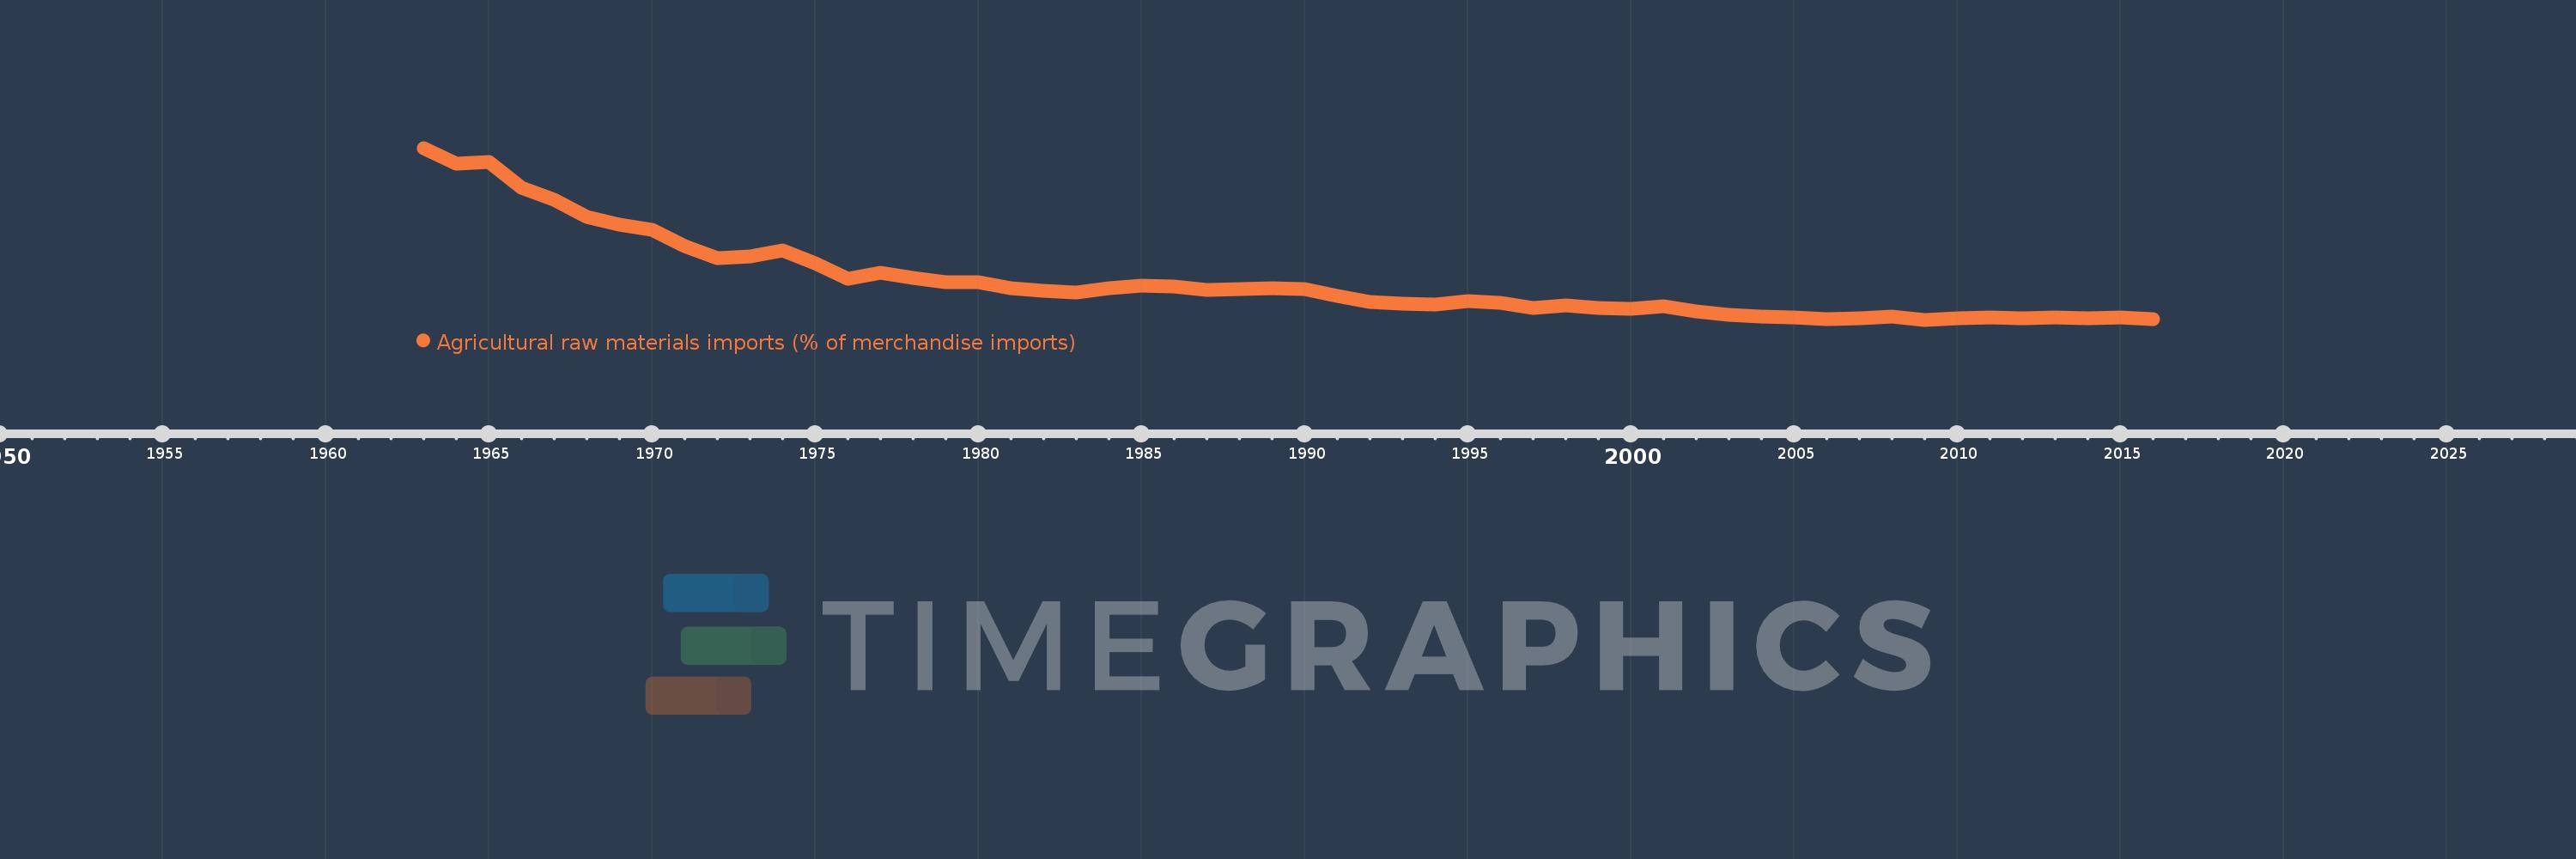
En esta escala de tiempo se presenta un gráfico de 1963 y 2016 de Belgium. Los datos de 1962 están ausentes. El número de observaciones reales por fecha: 54.
Fuente (nombre):
Indicadores del desarrollo mundial
Fuente (organización):
World Bank staff estimates from the Comtrade database maintained by the United Nations Statistics Division.
Categorías:
Agriculture & Rural Development, Private Sector, Trade
Se ha actualizado:
23 abr 2017 año
Los indicadores de los cambios de valor en los últimos años
Mínimo:
1.164
1 ene 2009 año
Máximo:
10.239
1 ene 1963 año
A la fecha de observación
Valor
Cambio absoluto
El cambio con respecto al valor anterior
1 ene 1963 año
10.239
+10.239
0.0%
1 ene 1964 año
9.423
-0.815
-7.96%
1 ene 1965 año
9.511
+0.088
0.93%
1 ene 1966 año
8.151
-1.361
-14.3%
1 ene 1967 año
7.485
-0.666
-8.17%
1 ene 1968 año
6.581
-0.904
-12.07%
1 ene 1969 año
6.189
-0.392
-5.96%
1 ene 1970 año
5.913
-0.276
-4.45%
1 ene 1971 año
5.053
-0.861
-14.56%
1 ene 1972 año
4.413
-0.64
-12.66%
1 ene 1973 año
4.521
+0.109
2.46%
1 ene 1974 año
4.816
+0.294
6.51%
1 ene 1975 año
4.143
-0.672
-13.96%
1 ene 1976 año
3.314
-0.829
-20.02%
1 ene 1977 año
3.654
+0.34
10.27%
1 ene 1978 año
3.357
-0.297
-8.13%
1 ene 1979 año
3.125
-0.232
-6.92%
1 ene 1980 año
3.126
+0.002
0.06%
1 ene 1981 año
2.807
-0.32
-10.23%
1 ene 1982 año
2.674
-0.133
-4.74%
1 ene 1983 año
2.588
-0.086
-3.21%
1 ene 1984 año
2.812
+0.224
8.66%
1 ene 1985 año
2.97
+0.158
5.61%
1 ene 1986 año
2.91
-0.06
-2.01%
1 ene 1987 año
2.73
-0.18
-6.18%
1 ene 1988 año
2.776
+0.046
1.69%
1 ene 1989 año
2.824
+0.048
1.73%
1 ene 1990 año
2.78
-0.045
-1.58%
1 ene 1991 año
2.412
-0.368
-13.22%
1 ene 1992 año
2.107
-0.305
-12.65%
1 ene 1993 año
2.035
-0.072
-3.4%
1 ene 1994 año
1.957
-0.079
-3.86%
1 ene 1995 año
2.13
+0.173
8.86%
1 ene 1996 año
2.08
-0.05
-2.33%
1 ene 1997 año
1.78
-0.301
-14.45%
1 ene 1998 año
1.908
+0.128
7.2%
1 ene 1999 año
1.775
-0.133
-6.96%
1 ene 2000 año
1.73
-0.045
-2.52%
1 ene 2001 año
1.876
+0.146
8.42%
1 ene 2002 año
1.625
-0.251
-13.37%
1 ene 2003 año
1.417
-0.208
-12.79%
1 ene 2004 año
1.332
-0.085
-6.02%
1 ene 2005 año
1.284
-0.048
-3.63%
1 ene 2006 año
1.19
-0.094
-7.3%
1 ene 2007 año
1.224
+0.034
2.83%
1 ene 2008 año
1.321
+0.097
7.92%
1 ene 2009 año
1.164
-0.157
-11.88%
1 ene 2010 año
1.245
+0.081
6.98%
1 ene 2011 año
1.28
+0.035
2.84%
1 ene 2012 año
1.262
-0.019
-1.46%
1 ene 2013 año
1.276
+0.014
1.14%
1 ene 2014 año
1.228
-0.049
-3.81%
1 ene 2015 año
1.266
+0.038
3.12%
1 ene 2016 año
1.207
-0.059
-4.63%
Ranking de los países por los datos estadísticos actuales


Comentarios: