29
/es/
es
AIzaSyAYiBZKx7MnpbEhh9jyipgxe19OcubqV5w
April 1, 2024
149959
Honduras
HND
true
2
1
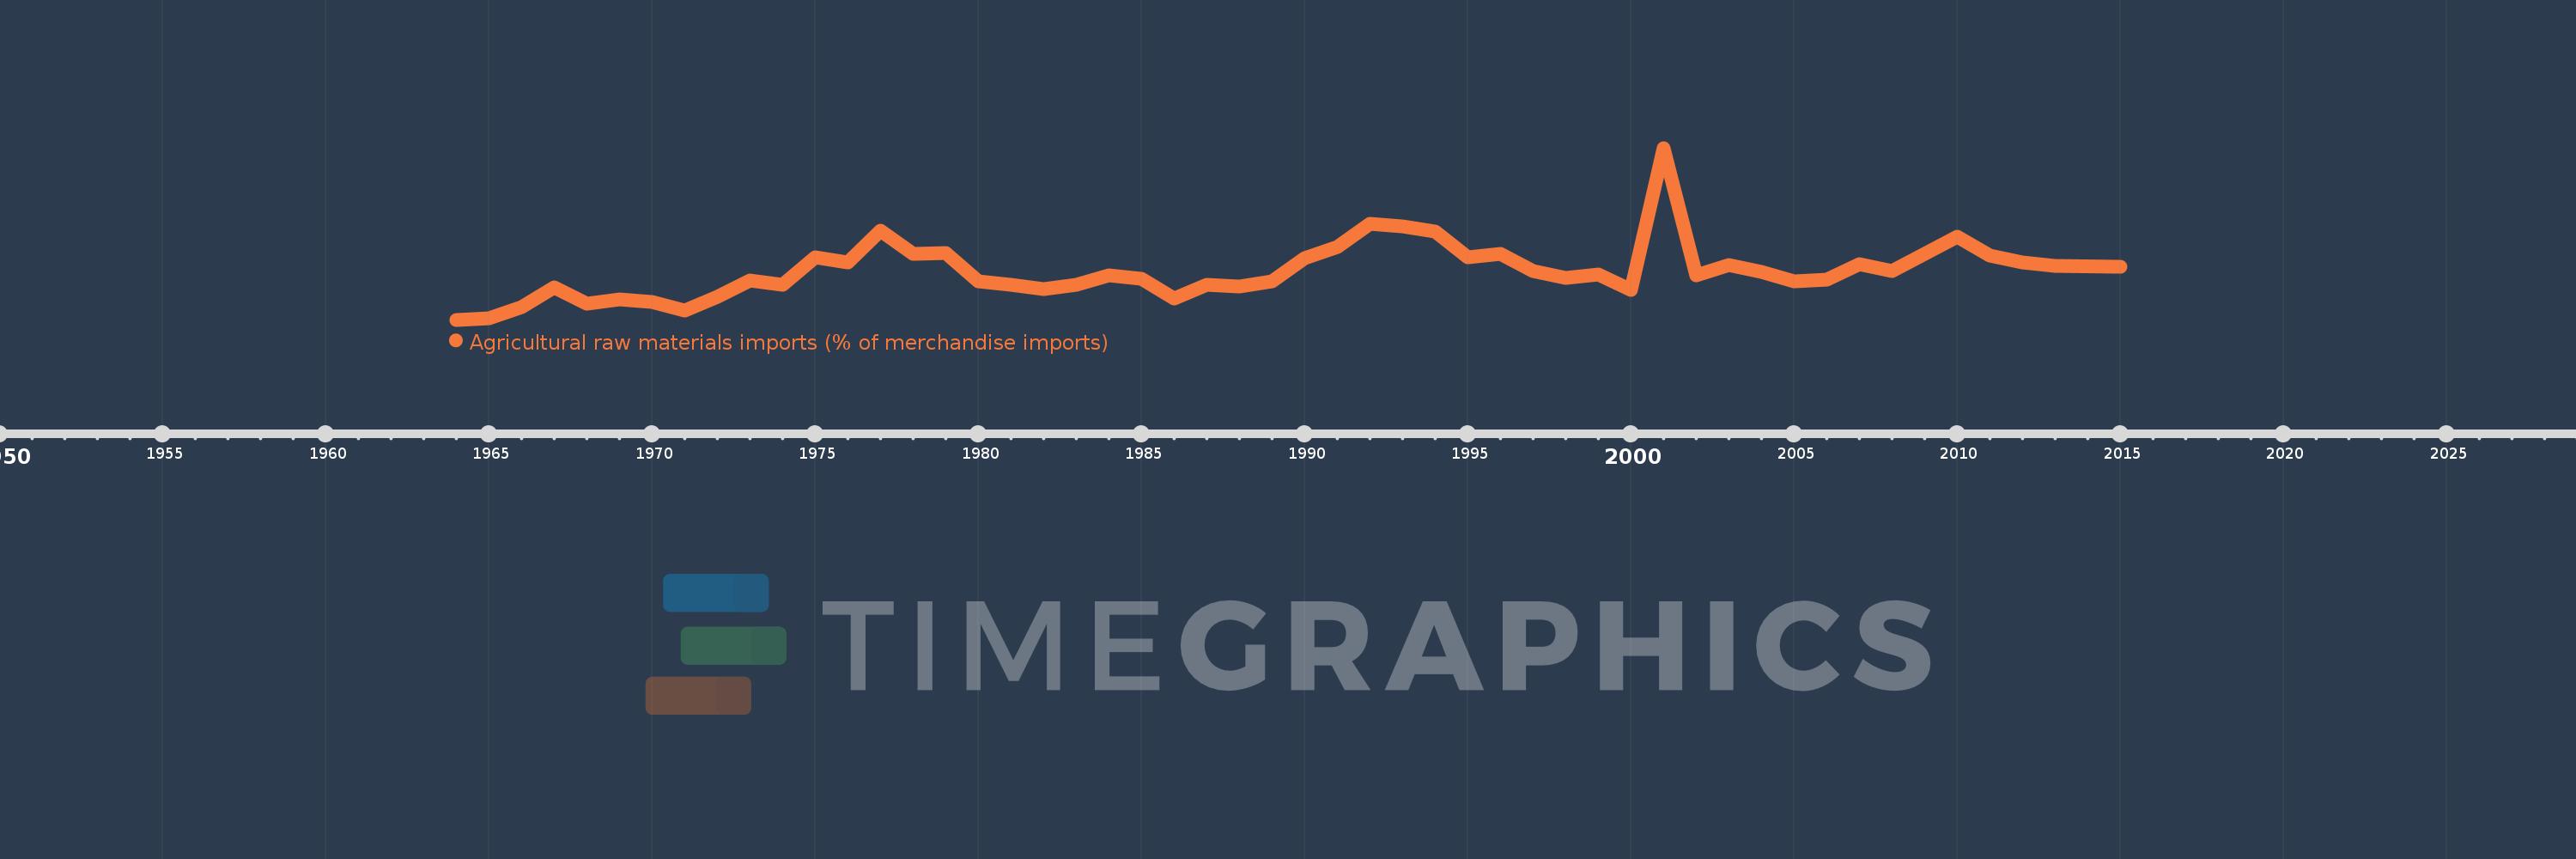
Agricultural raw materials imports (% of merchandise imports)
2015,2013,2012,2011,2010,2008,2007,2006,2005,2004,2003,2002,2001,2000,1999,1998,1997,1996,1995,1994,1993,1992,1991,1990,1989,1988,1987,1986,1985,1984,1983,1982,1981,1980,1979,1978,1977,1976,1975,1974,1973,1972,1971,1970,1969,1968,1967,1966,1965,1964
Estas estadísticas en otros países:
AfghanistanAlbaniaAlgeriaAndorraAngolaAntigua and BarbudaArab WorldArgentinaArmeniaArubaAustraliaAustriaAzerbaijanBahamas, TheBahrainBangladeshBarbadosBelarusBelgiumBelizeBeninBermudaBhutanBoliviaBosnia and HerzegovinaBotswanaBrazilBrunei DarussalamBulgariaBurkina FasoBurundiCabo VerdeCambodiaCameroonCanadaCaribbean small statesCayman IslandsCentral African RepublicCentral Europe and the BalticsChadChileChinaColombiaComorosCongo, Dem. Rep.Congo, Rep.Costa RicaCote d'IvoireCroatiaCubaCyprusCzech RepublicDenmarkDjiboutiDominicaDominican RepublicEarly-demographic dividendEast Asia & PacificEast Asia & Pacific (excluding high income)East Asia & Pacific (IDA & IBRD countries)EcuadorEgypt, Arab Rep.El SalvadorEquatorial GuineaEritreaEstoniaEthiopiaEuro areaEurope & Central AsiaEurope & Central Asia (excluding high income)Europe & Central Asia (IDA & IBRD countries)European UnionFaroe IslandsFijiFinlandFragile and conflict affected situationsFranceFrench PolynesiaGabonGambia, TheGeorgiaGermanyGhanaGreeceGreenlandGrenadaGuatemalaGuineaGuinea-BissauGuyanaHaitiHeavily indebted poor countries (HIPC)High incomeHondurasHong Kong SAR, ChinaHungaryIBRD onlyIcelandIDA & IBRD totalIDA blendIDA onlyIDA totalIndiaIndonesiaIran, Islamic Rep.IraqIrelandIsraelItalyJamaicaJapanJordanKazakhstanKenyaKiribatiKorea, Rep.KuwaitKyrgyz RepublicLao PDRLate-demographic dividendLatin America & Caribbean Latin America & Caribbean (excluding high income)Latin America & the Caribbean (IDA & IBRD countries)LatviaLeast developed countries: UN classificationLebanonLesothoLiberiaLibyaLithuaniaLow & middle incomeLow incomeLower middle incomeLuxembourgMacao SAR, ChinaMacedonia, FYRMadagascarMalawiMalaysiaMaldivesMaliMaltaMauritaniaMauritiusMexicoMiddle East & North AfricaMiddle East & North Africa (excluding high income)Middle East & North Africa (IDA & IBRD countries)Middle incomeMoldovaMongoliaMoroccoMozambiqueMyanmarNamibiaNepalNetherlandsNew CaledoniaNew ZealandNicaraguaNigerNigeriaNorth AmericaNorwayOECD membersOmanOther small statesPacific island small statesPakistanPalauPanamaPapua New GuineaParaguayPeruPhilippinesPolandPortugalPost-demographic dividendPre-demographic dividendQatarRomaniaRussian FederationRwandaSamoaSao Tome and PrincipeSaudi ArabiaSenegalSerbiaSeychellesSierra LeoneSingaporeSlovak RepublicSloveniaSmall statesSolomon IslandsSomaliaSouth AfricaSouth AsiaSouth Asia (IDA & IBRD)SpainSri LankaSt. Kitts and NevisSt. LuciaSt. Vincent and the GrenadinesSub-Saharan Africa Sub-Saharan Africa (excluding high income)Sub-Saharan Africa (IDA & IBRD countries)SudanSurinameSwazilandSwedenSwitzerlandSyrian Arab RepublicTajikistanTanzaniaThailandTimor-LesteTogoTongaTrinidad and TobagoTunisiaTurkeyTurkmenistanTurks and Caicos IslandsTuvaluUgandaUkraineUnited Arab EmiratesUnited KingdomUnited StatesUpper middle incomeUruguayVanuatuVenezuela, RBVietnamVirgin Islands (U.S.)WorldYemen, Rep.ZambiaZimbabwe línea de tiempo (timeline):
En esta escala de tiempo se presenta un gráfico de 1964 y 2015 de Honduras. Los datos de 1963 están ausentes. El número de observaciones reales por fecha: 50.
Fuente (nombre):
Indicadores del desarrollo mundial
Fuente (organización):
World Bank staff estimates from the Comtrade database maintained by the United Nations Statistics Division.
Categorías:
Agriculture & Rural Development, Private Sector, Trade
Se ha actualizado:
23 abr 2017 año
Los indicadores de los cambios de valor en los últimos años
Mínimo:
0.27
1 ene 1964 año
Máximo:
2.395
1 ene 2001 año
A la fecha de observación
Valor
Cambio absoluto
El cambio con respecto al valor anterior
1 ene 1964 año
0.27
+0.27
0.0%
1 ene 1965 año
0.289
+0.019
6.88%
1 ene 1966 año
0.427
+0.139
48.0%
1 ene 1967 año
0.675
+0.248
58.13%
1 ene 1968 año
0.47
-0.205
-30.4%
1 ene 1969 año
0.52
+0.05
10.66%
1 ene 1970 año
0.492
-0.028
-5.46%
1 ene 1971 año
0.386
-0.106
-21.58%
1 ene 1972 año
0.557
+0.172
44.5%
1 ene 1973 año
0.76
+0.203
36.44%
1 ene 1974 año
0.699
-0.062
-8.13%
1 ene 1975 año
1.042
+0.343
49.11%
1 ene 1976 año
0.976
-0.066
-6.31%
1 ene 1977 año
1.375
+0.399
40.93%
1 ene 1978 año
1.089
-0.286
-20.82%
1 ene 1979 año
1.091
+0.002
0.17%
1 ene 1980 año
0.74
-0.351
-32.18%
1 ene 1981 año
0.703
-0.036
-4.91%
1 ene 1982 año
0.654
-0.05
-7.06%
1 ene 1983 año
0.699
+0.045
6.95%
1 ene 1984 año
0.817
+0.118
16.88%
1 ene 1985 año
0.779
-0.038
-4.65%
1 ene 1986 año
0.53
-0.249
-31.95%
1 ene 1987 año
0.699
+0.169
31.78%
1 ene 1988 año
0.676
-0.023
-3.3%
1 ene 1989 año
0.749
+0.073
10.82%
1 ene 1990 año
1.028
+0.279
37.26%
1 ene 1991 año
1.174
+0.146
14.23%
1 ene 1992 año
1.458
+0.283
24.14%
1 ene 1993 año
1.43
-0.027
-1.87%
1 ene 1994 año
1.358
-0.072
-5.04%
1 ene 1995 año
1.044
-0.314
-23.11%
1 ene 1996 año
1.085
+0.041
3.89%
1 ene 1997 año
0.875
-0.21
-19.38%
1 ene 1998 año
0.787
-0.088
-10.03%
1 ene 1999 año
0.833
+0.046
5.87%
1 ene 2000 año
0.643
-0.19
-22.8%
1 ene 2001 año
2.395
+1.752
272.41%
1 ene 2002 año
0.821
-1.574
-65.72%
1 ene 2003 año
0.946
+0.125
15.25%
1 ene 2004 año
0.86
-0.087
-9.14%
1 ene 2005 año
0.745
-0.115
-13.41%
1 ene 2006 año
0.764
+0.019
2.57%
1 ene 2007 año
0.958
+0.195
25.48%
1 ene 2008 año
0.87
-0.089
-9.26%
1 ene 2010 año
1.295
+0.425
48.89%
1 ene 2011 año
1.064
-0.231
-17.8%
1 ene 2012 año
0.979
-0.085
-8.01%
1 ene 2013 año
0.941
-0.038
-3.89%
1 ene 2015 año
0.93
-0.011
-1.16%
Ranking de los países por los datos estadísticos actuales


Comentarios: