29
/es/
es
AIzaSyAYiBZKx7MnpbEhh9jyipgxe19OcubqV5w
April 1, 2024
212592
Nigeria
NGA
true
2
1
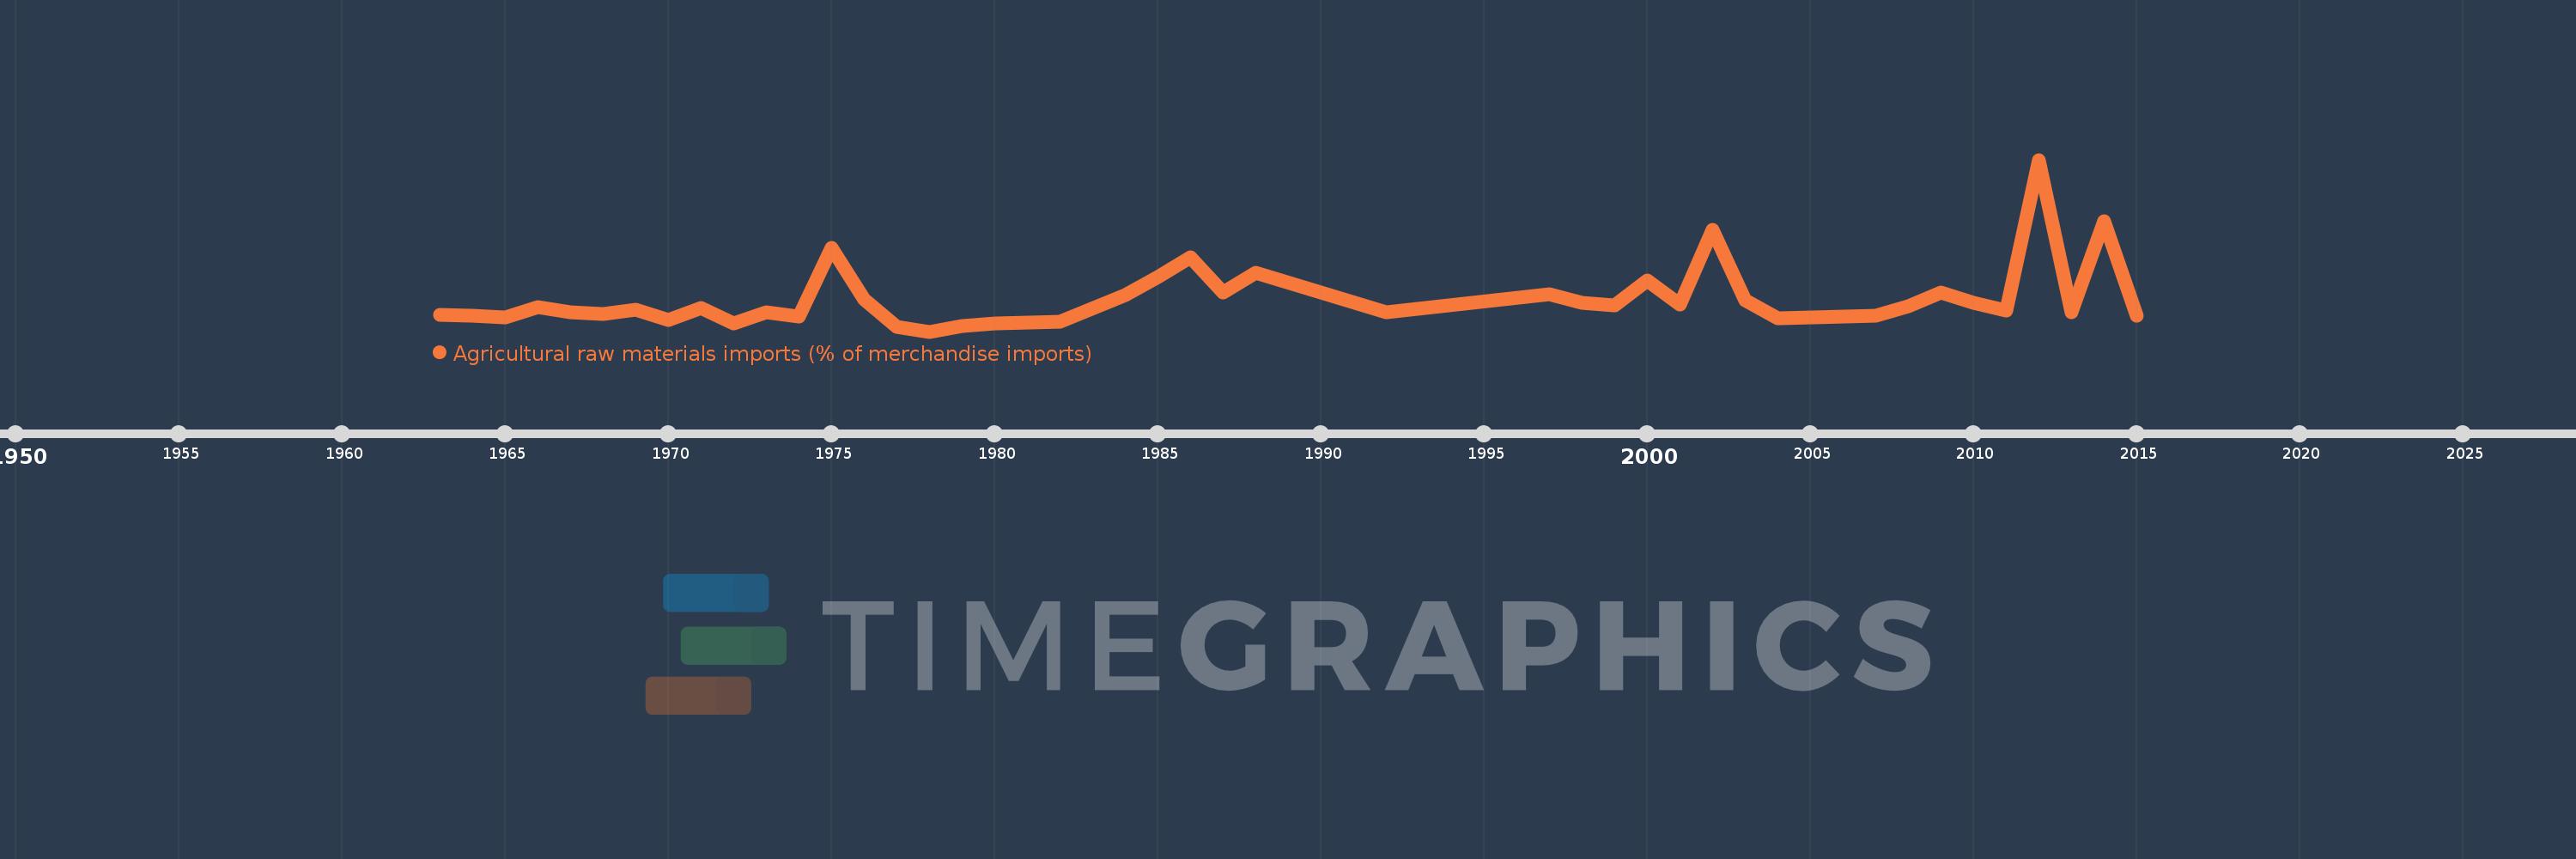
Agricultural raw materials imports (% of merchandise imports)
2015,2014,2013,2012,2011,2010,2009,2008,2007,2004,2003,2002,2001,2000,1999,1998,1997,1992,1988,1987,1986,1985,1984,1982,1980,1979,1978,1977,1976,1975,1974,1973,1972,1971,1970,1969,1968,1967,1966,1965,1964,1963
Estas estadísticas en otros países:
AfghanistanAlbaniaAlgeriaAndorraAngolaAntigua and BarbudaArab WorldArgentinaArmeniaArubaAustraliaAustriaAzerbaijanBahamas, TheBahrainBangladeshBarbadosBelarusBelgiumBelizeBeninBermudaBhutanBoliviaBosnia and HerzegovinaBotswanaBrazilBrunei DarussalamBulgariaBurkina FasoBurundiCabo VerdeCambodiaCameroonCanadaCaribbean small statesCayman IslandsCentral African RepublicCentral Europe and the BalticsChadChileChinaColombiaComorosCongo, Dem. Rep.Congo, Rep.Costa RicaCote d'IvoireCroatiaCubaCyprusCzech RepublicDenmarkDjiboutiDominicaDominican RepublicEarly-demographic dividendEast Asia & PacificEast Asia & Pacific (excluding high income)East Asia & Pacific (IDA & IBRD countries)EcuadorEgypt, Arab Rep.El SalvadorEquatorial GuineaEritreaEstoniaEthiopiaEuro areaEurope & Central AsiaEurope & Central Asia (excluding high income)Europe & Central Asia (IDA & IBRD countries)European UnionFaroe IslandsFijiFinlandFragile and conflict affected situationsFranceFrench PolynesiaGabonGambia, TheGeorgiaGermanyGhanaGreeceGreenlandGrenadaGuatemalaGuineaGuinea-BissauGuyanaHaitiHeavily indebted poor countries (HIPC)High incomeHondurasHong Kong SAR, ChinaHungaryIBRD onlyIcelandIDA & IBRD totalIDA blendIDA onlyIDA totalIndiaIndonesiaIran, Islamic Rep.IraqIrelandIsraelItalyJamaicaJapanJordanKazakhstanKenyaKiribatiKorea, Rep.KuwaitKyrgyz RepublicLao PDRLate-demographic dividendLatin America & Caribbean Latin America & Caribbean (excluding high income)Latin America & the Caribbean (IDA & IBRD countries)LatviaLeast developed countries: UN classificationLebanonLesothoLiberiaLibyaLithuaniaLow & middle incomeLow incomeLower middle incomeLuxembourgMacao SAR, ChinaMacedonia, FYRMadagascarMalawiMalaysiaMaldivesMaliMaltaMauritaniaMauritiusMexicoMiddle East & North AfricaMiddle East & North Africa (excluding high income)Middle East & North Africa (IDA & IBRD countries)Middle incomeMoldovaMongoliaMoroccoMozambiqueMyanmarNamibiaNepalNetherlandsNew CaledoniaNew ZealandNicaraguaNigerNigeriaNorth AmericaNorwayOECD membersOmanOther small statesPacific island small statesPakistanPalauPanamaPapua New GuineaParaguayPeruPhilippinesPolandPortugalPost-demographic dividendPre-demographic dividendQatarRomaniaRussian FederationRwandaSamoaSao Tome and PrincipeSaudi ArabiaSenegalSerbiaSeychellesSierra LeoneSingaporeSlovak RepublicSloveniaSmall statesSolomon IslandsSomaliaSouth AfricaSouth AsiaSouth Asia (IDA & IBRD)SpainSri LankaSt. Kitts and NevisSt. LuciaSt. Vincent and the GrenadinesSub-Saharan Africa Sub-Saharan Africa (excluding high income)Sub-Saharan Africa (IDA & IBRD countries)SudanSurinameSwazilandSwedenSwitzerlandSyrian Arab RepublicTajikistanTanzaniaThailandTimor-LesteTogoTongaTrinidad and TobagoTunisiaTurkeyTurkmenistanTurks and Caicos IslandsTuvaluUgandaUkraineUnited Arab EmiratesUnited KingdomUnited StatesUpper middle incomeUruguayVanuatuVenezuela, RBVietnamVirgin Islands (U.S.)WorldYemen, Rep.ZambiaZimbabwe línea de tiempo (timeline):
En esta escala de tiempo se presenta un gráfico de 1963 y 2015 de Nigeria. Los datos de 1962 están ausentes. El número de observaciones reales por fecha: 42.
Fuente (nombre):
Indicadores del desarrollo mundial
Fuente (organización):
World Bank staff estimates from the Comtrade database maintained by the United Nations Statistics Division.
Categorías:
Agriculture & Rural Development, Private Sector, Trade
Se ha actualizado:
23 abr 2017 año
Los indicadores de los cambios de valor en los últimos años
Mínimo:
0.304
1 ene 1978 año
Máximo:
4.204
1 ene 2012 año
A la fecha de observación
Valor
Cambio absoluto
El cambio con respecto al valor anterior
1 ene 1963 año
0.68
+0.68
0.0%
1 ene 1964 año
0.66
-0.019
-2.86%
1 ene 1965 año
0.622
-0.038
-5.72%
1 ene 1966 año
0.868
+0.246
39.48%
1 ene 1967 año
0.747
-0.121
-13.99%
1 ene 1968 año
0.7
-0.047
-6.27%
1 ene 1969 año
0.804
+0.104
14.86%
1 ene 1970 año
0.572
-0.232
-28.82%
1 ene 1971 año
0.839
+0.267
46.59%
1 ene 1972 año
0.498
-0.341
-40.6%
1 ene 1973 año
0.735
+0.237
47.57%
1 ene 1974 año
0.641
-0.094
-12.84%
1 ene 1975 año
2.212
+1.572
245.23%
1 ene 1976 año
1.033
-1.179
-53.3%
1 ene 1977 año
0.414
-0.619
-59.9%
1 ene 1978 año
0.304
-0.11
-26.59%
1 ene 1979 año
0.435
+0.131
43.1%
1 ene 1980 año
0.49
+0.055
12.55%
1 ene 1982 año
0.521
+0.031
6.37%
1 ene 1984 año
1.134
+0.613
117.56%
1 ene 1985 año
1.543
+0.409
36.06%
1 ene 1986 año
1.995
+0.452
29.3%
1 ene 1987 año
1.199
-0.795
-39.88%
1 ene 1988 año
1.632
+0.433
36.1%
1 ene 1992 año
0.741
-0.891
-54.57%
1 ene 1997 año
1.162
+0.42
56.68%
1 ene 1998 año
0.959
-0.203
-17.49%
1 ene 1999 año
0.9
-0.058
-6.08%
1 ene 2000 año
1.456
+0.556
61.74%
1 ene 2001 año
0.925
-0.532
-36.5%
1 ene 2002 año
2.613
+1.689
182.64%
1 ene 2003 año
1.024
-1.589
-60.82%
1 ene 2004 año
0.604
-0.42
-40.99%
1 ene 2007 año
0.666
+0.062
10.28%
1 ene 2008 año
0.875
+0.209
31.32%
1 ene 2009 año
1.189
+0.314
35.93%
1 ene 2010 año
0.954
-0.235
-19.74%
1 ene 2011 año
0.777
-0.177
-18.54%
1 ene 2012 año
4.204
+3.427
440.77%
1 ene 2013 año
0.745
-3.46
-82.29%
1 ene 2014 año
2.801
+2.056
276.09%
1 ene 2015 año
0.668
-2.133
-76.15%
Ranking de los países por los datos estadísticos actuales


Comentarios: