29
/es/
es
AIzaSyAYiBZKx7MnpbEhh9jyipgxe19OcubqV5w
April 1, 2024
217941
Panama
PAN
true
2
1
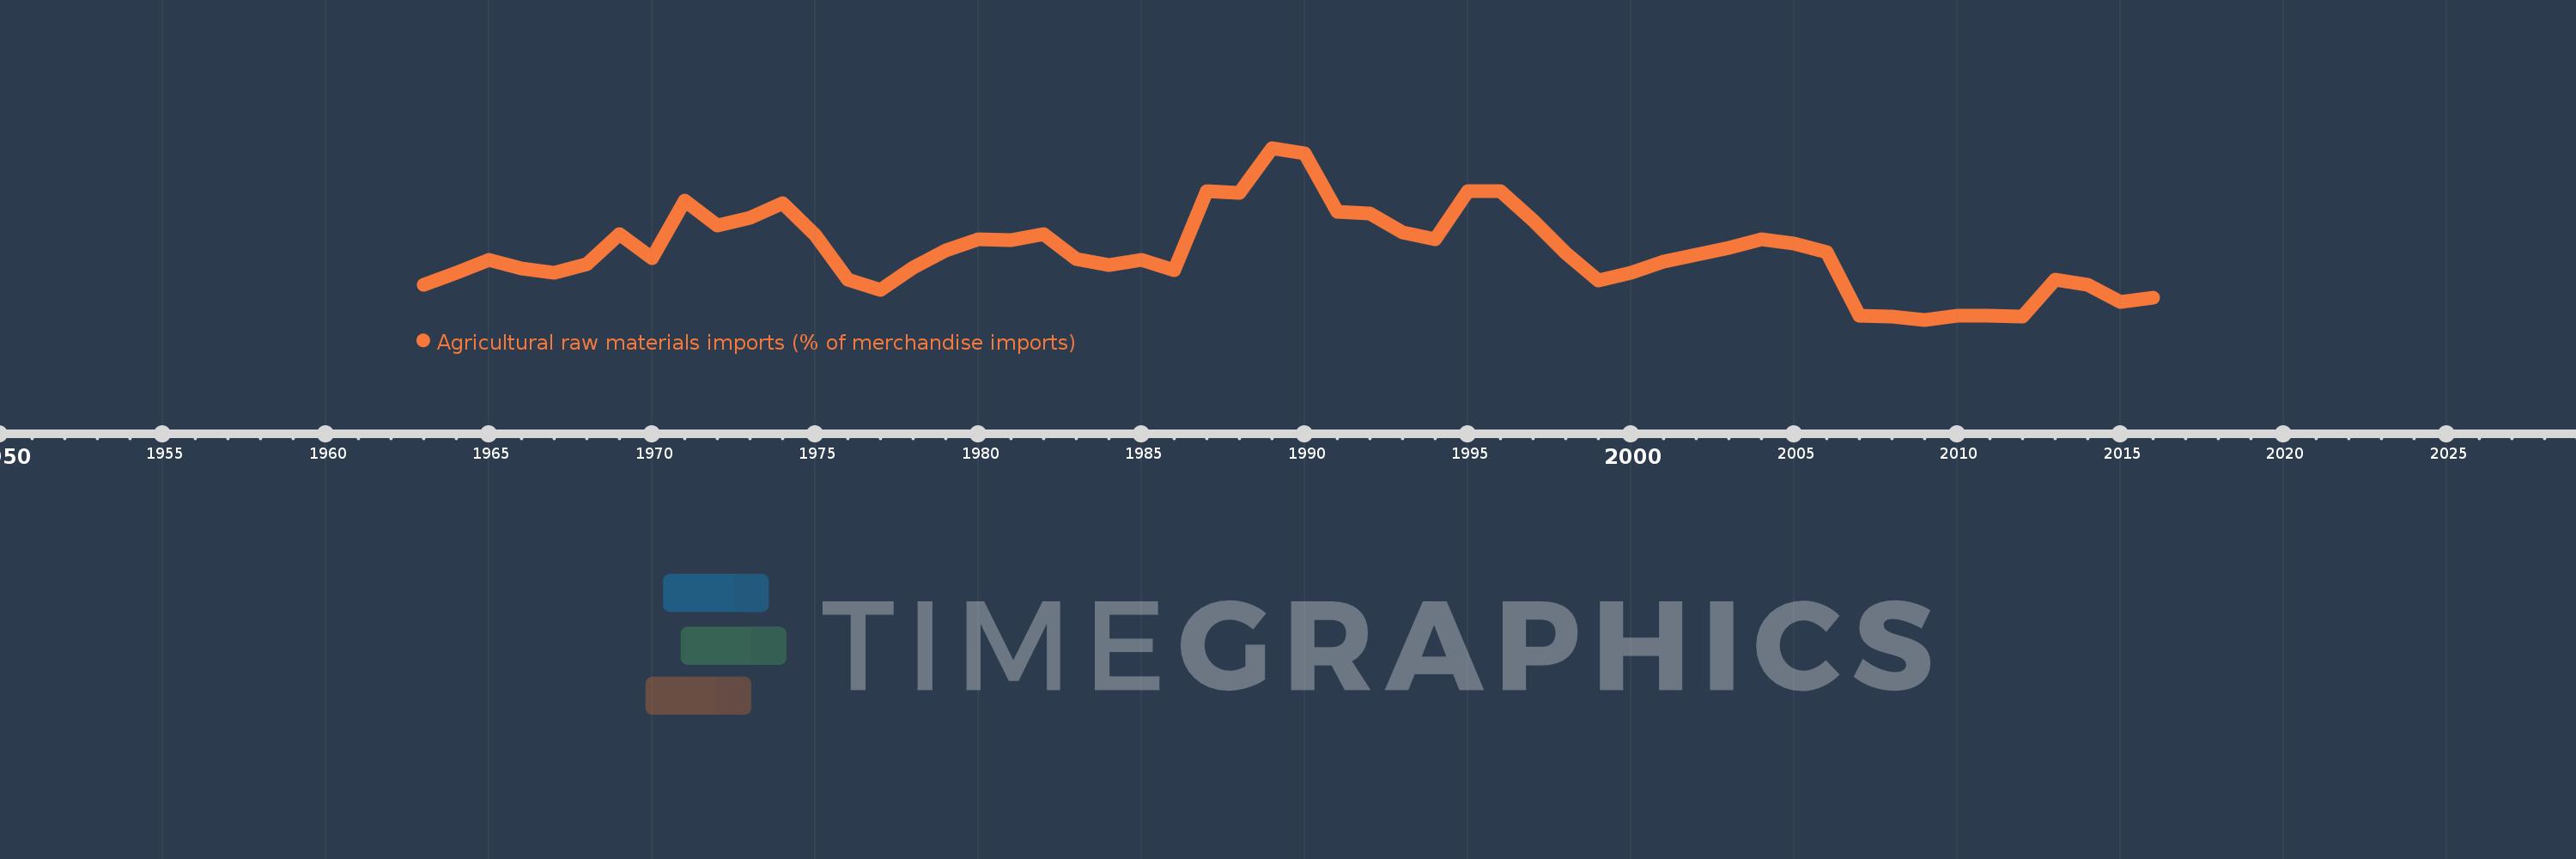
Agricultural raw materials imports (% of merchandise imports)
2016,2015,2014,2013,2012,2011,2010,2009,2008,2007,2006,2005,2004,2003,2002,2001,2000,1999,1998,1997,1996,1995,1994,1993,1992,1991,1990,1989,1988,1987,1986,1985,1984,1983,1982,1981,1980,1979,1978,1977,1976,1975,1974,1973,1972,1971,1970,1969,1968,1967,1966,1965,1964,1963
Estas estadísticas en otros países:
AfghanistanAlbaniaAlgeriaAndorraAngolaAntigua and BarbudaArab WorldArgentinaArmeniaArubaAustraliaAustriaAzerbaijanBahamas, TheBahrainBangladeshBarbadosBelarusBelgiumBelizeBeninBermudaBhutanBoliviaBosnia and HerzegovinaBotswanaBrazilBrunei DarussalamBulgariaBurkina FasoBurundiCabo VerdeCambodiaCameroonCanadaCaribbean small statesCayman IslandsCentral African RepublicCentral Europe and the BalticsChadChileChinaColombiaComorosCongo, Dem. Rep.Congo, Rep.Costa RicaCote d'IvoireCroatiaCubaCyprusCzech RepublicDenmarkDjiboutiDominicaDominican RepublicEarly-demographic dividendEast Asia & PacificEast Asia & Pacific (excluding high income)East Asia & Pacific (IDA & IBRD countries)EcuadorEgypt, Arab Rep.El SalvadorEquatorial GuineaEritreaEstoniaEthiopiaEuro areaEurope & Central AsiaEurope & Central Asia (excluding high income)Europe & Central Asia (IDA & IBRD countries)European UnionFaroe IslandsFijiFinlandFragile and conflict affected situationsFranceFrench PolynesiaGabonGambia, TheGeorgiaGermanyGhanaGreeceGreenlandGrenadaGuatemalaGuineaGuinea-BissauGuyanaHaitiHeavily indebted poor countries (HIPC)High incomeHondurasHong Kong SAR, ChinaHungaryIBRD onlyIcelandIDA & IBRD totalIDA blendIDA onlyIDA totalIndiaIndonesiaIran, Islamic Rep.IraqIrelandIsraelItalyJamaicaJapanJordanKazakhstanKenyaKiribatiKorea, Rep.KuwaitKyrgyz RepublicLao PDRLate-demographic dividendLatin America & Caribbean Latin America & Caribbean (excluding high income)Latin America & the Caribbean (IDA & IBRD countries)LatviaLeast developed countries: UN classificationLebanonLesothoLiberiaLibyaLithuaniaLow & middle incomeLow incomeLower middle incomeLuxembourgMacao SAR, ChinaMacedonia, FYRMadagascarMalawiMalaysiaMaldivesMaliMaltaMauritaniaMauritiusMexicoMiddle East & North AfricaMiddle East & North Africa (excluding high income)Middle East & North Africa (IDA & IBRD countries)Middle incomeMoldovaMongoliaMoroccoMozambiqueMyanmarNamibiaNepalNetherlandsNew CaledoniaNew ZealandNicaraguaNigerNigeriaNorth AmericaNorwayOECD membersOmanOther small statesPacific island small statesPakistanPalauPanamaPapua New GuineaParaguayPeruPhilippinesPolandPortugalPost-demographic dividendPre-demographic dividendQatarRomaniaRussian FederationRwandaSamoaSao Tome and PrincipeSaudi ArabiaSenegalSerbiaSeychellesSierra LeoneSingaporeSlovak RepublicSloveniaSmall statesSolomon IslandsSomaliaSouth AfricaSouth AsiaSouth Asia (IDA & IBRD)SpainSri LankaSt. Kitts and NevisSt. LuciaSt. Vincent and the GrenadinesSub-Saharan Africa Sub-Saharan Africa (excluding high income)Sub-Saharan Africa (IDA & IBRD countries)SudanSurinameSwazilandSwedenSwitzerlandSyrian Arab RepublicTajikistanTanzaniaThailandTimor-LesteTogoTongaTrinidad and TobagoTunisiaTurkeyTurkmenistanTurks and Caicos IslandsTuvaluUgandaUkraineUnited Arab EmiratesUnited KingdomUnited StatesUpper middle incomeUruguayVanuatuVenezuela, RBVietnamVirgin Islands (U.S.)WorldYemen, Rep.ZambiaZimbabwe línea de tiempo (timeline):
En esta escala de tiempo se presenta un gráfico de 1963 y 2016 de Panama. Los datos de 1962 están ausentes. El número de observaciones reales por fecha: 54.
Fuente (nombre):
Indicadores del desarrollo mundial
Fuente (organización):
World Bank staff estimates from the Comtrade database maintained by the United Nations Statistics Division.
Categorías:
Agriculture & Rural Development, Private Sector, Trade
Se ha actualizado:
23 abr 2017 año
Los indicadores de los cambios de valor en los últimos años
Mínimo:
0.213
1 ene 2009 año
A la fecha de observación
Valor
Cambio absoluto
El cambio con respecto al valor anterior
1 ene 1963 año
0.375
+0.375
0.0%
1 ene 1964 año
0.429
+0.055
14.57%
1 ene 1965 año
0.487
+0.058
13.47%
1 ene 1966 año
0.447
-0.04
-8.24%
1 ene 1967 año
0.429
-0.018
-3.94%
1 ene 1968 año
0.468
+0.039
9.04%
1 ene 1969 año
0.607
+0.139
29.78%
1 ene 1970 año
0.494
-0.114
-18.74%
1 ene 1971 año
0.757
+0.264
53.43%
1 ene 1972 año
0.643
-0.114
-15.09%
1 ene 1973 año
0.681
+0.038
5.96%
1 ene 1974 año
0.748
+0.067
9.84%
1 ene 1975 año
0.601
-0.147
-19.68%
1 ene 1976 año
0.397
-0.204
-34.01%
1 ene 1977 año
0.348
-0.049
-12.29%
1 ene 1978 año
0.452
+0.104
29.89%
1 ene 1979 año
0.53
+0.078
17.35%
1 ene 1980 año
0.581
+0.05
9.5%
1 ene 1981 año
0.576
-0.005
-0.86%
1 ene 1982 año
0.605
+0.029
5.09%
1 ene 1983 año
0.493
-0.112
-18.5%
1 ene 1984 año
0.462
-0.031
-6.31%
1 ene 1985 año
0.488
+0.026
5.68%
1 ene 1986 año
0.441
-0.047
-9.58%
1 ene 1987 año
0.802
+0.361
81.79%
1 ene 1988 año
0.796
-0.007
-0.86%
1 ene 1989 año
1.0
+0.204
25.67%
1 ene 1990 año
0.976
-0.024
-2.4%
1 ene 1991 año
0.708
-0.268
-27.45%
1 ene 1992 año
0.7
-0.008
-1.15%
1 ene 1993 año
0.615
-0.085
-12.17%
1 ene 1994 año
0.583
-0.032
-5.15%
1 ene 1995 año
0.804
+0.221
37.84%
1 ene 1996 año
0.803
-0.001
-0.07%
1 ene 1997 año
0.668
-0.135
-16.79%
1 ene 1998 año
0.519
-0.149
-22.35%
1 ene 1999 año
0.394
-0.125
-24.09%
1 ene 2000 año
0.427
+0.033
8.47%
1 ene 2001 año
0.478
+0.051
11.91%
1 ene 2002 año
0.511
+0.033
6.82%
1 ene 2003 año
0.541
+0.03
5.88%
1 ene 2004 año
0.583
+0.042
7.85%
1 ene 2005 año
0.561
-0.022
-3.81%
1 ene 2006 año
0.523
-0.038
-6.75%
1 ene 2007 año
0.232
-0.291
-55.65%
1 ene 2008 año
0.226
-0.006
-2.51%
1 ene 2009 año
0.213
-0.013
-5.89%
1 ene 2010 año
0.23
+0.017
8.01%
1 ene 2011 año
0.233
+0.003
1.42%
1 ene 2012 año
0.228
-0.006
-2.37%
1 ene 2013 año
0.396
+0.169
74.05%
1 ene 2014 año
0.373
-0.023
-5.86%
1 ene 2015 año
0.296
-0.077
-20.54%
1 ene 2016 año
0.314
+0.017
5.88%
Ranking de los países por los datos estadísticos actuales


Comentarios: