29
/es/
es
AIzaSyAYiBZKx7MnpbEhh9jyipgxe19OcubqV5w
April 1, 2024
43192
Latin America & the Caribbean (IDA & IBRD countries)
TLA
false
2
1
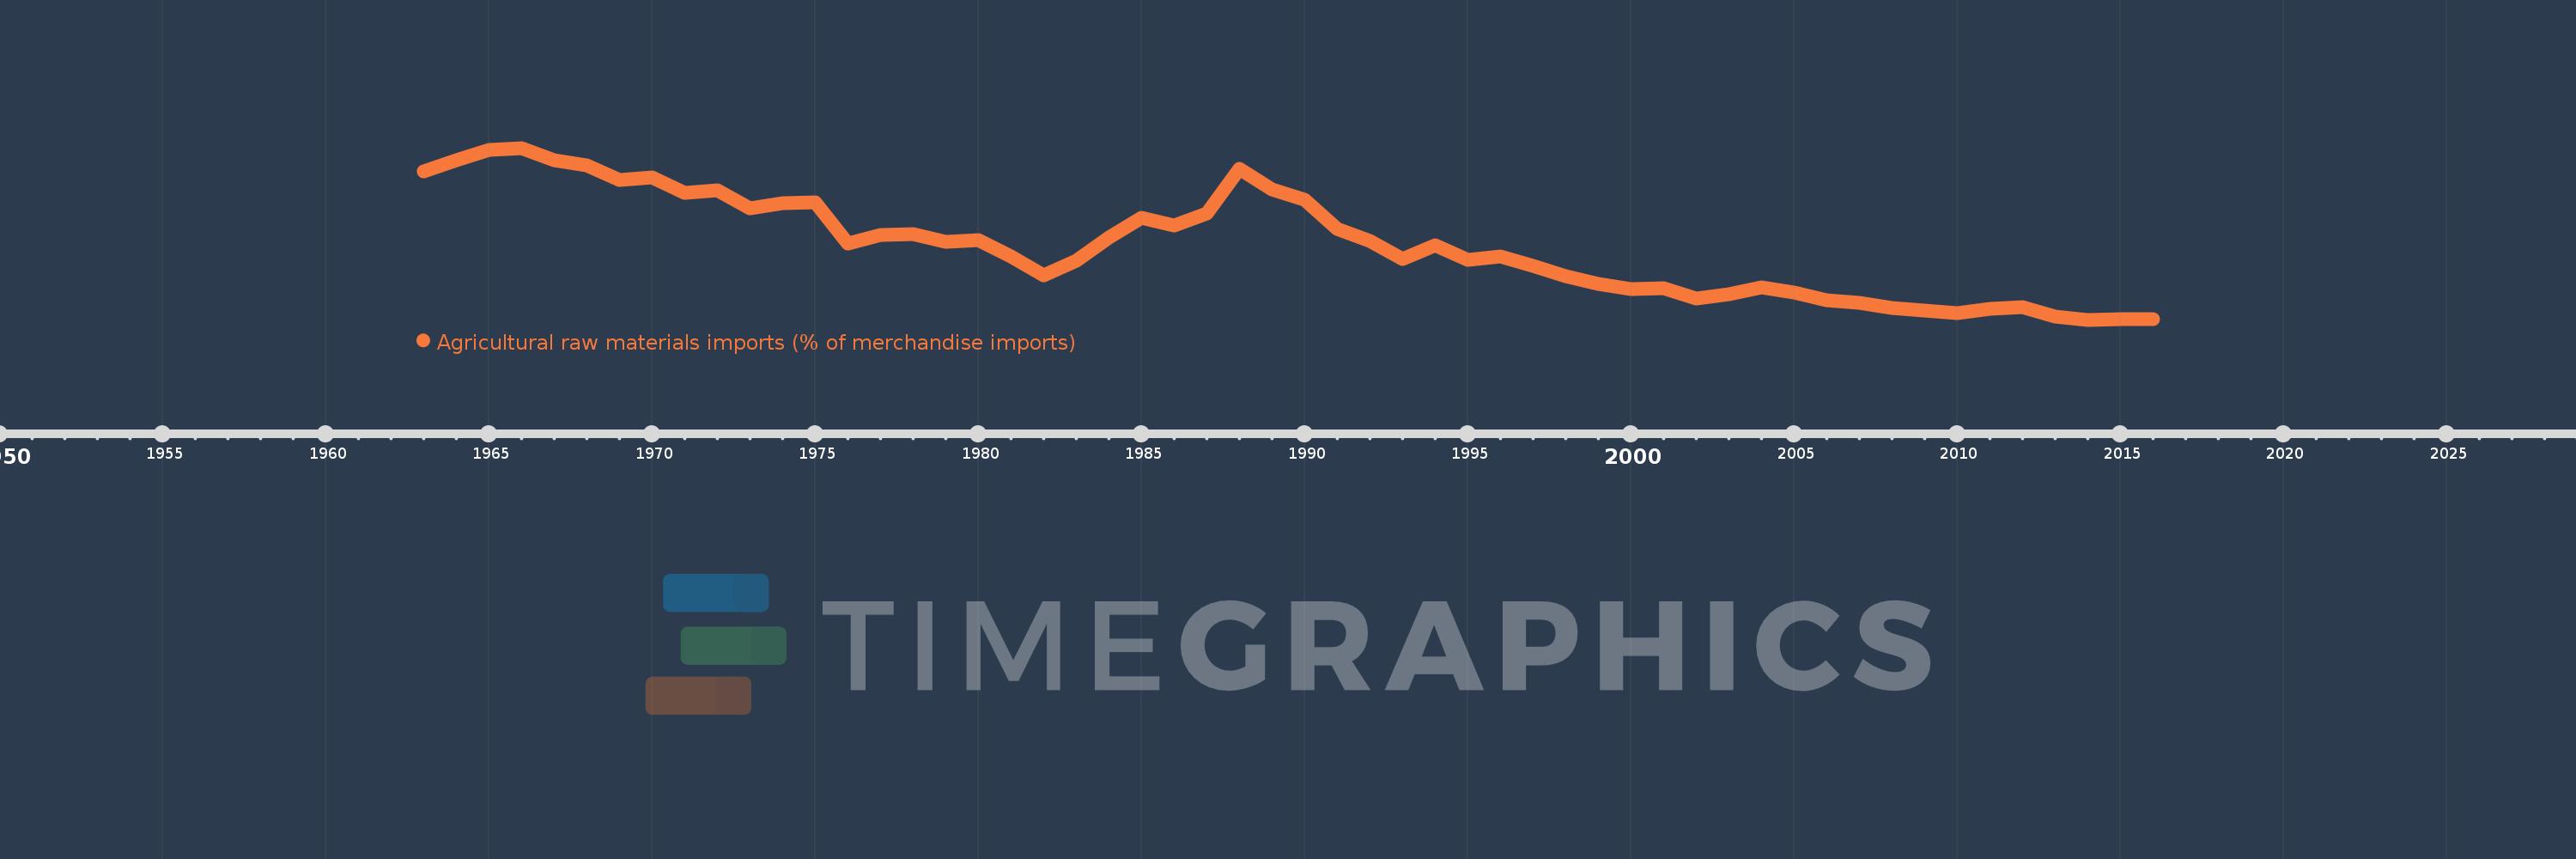
Agricultural raw materials imports (% of merchandise imports)
2016,2015,2014,2013,2012,2011,2010,2009,2008,2007,2006,2005,2004,2003,2002,2001,2000,1999,1998,1997,1996,1995,1994,1993,1992,1991,1990,1989,1988,1987,1986,1985,1984,1983,1982,1981,1980,1979,1978,1977,1976,1975,1974,1973,1972,1971,1970,1969,1968,1967,1966,1965,1964,1963
Estas estadísticas en otros países:
AfghanistanAlbaniaAlgeriaAndorraAngolaAntigua and BarbudaArab WorldArgentinaArmeniaArubaAustraliaAustriaAzerbaijanBahamas, TheBahrainBangladeshBarbadosBelarusBelgiumBelizeBeninBermudaBhutanBoliviaBosnia and HerzegovinaBotswanaBrazilBrunei DarussalamBulgariaBurkina FasoBurundiCabo VerdeCambodiaCameroonCanadaCaribbean small statesCayman IslandsCentral African RepublicCentral Europe and the BalticsChadChileChinaColombiaComorosCongo, Dem. Rep.Congo, Rep.Costa RicaCote d'IvoireCroatiaCubaCyprusCzech RepublicDenmarkDjiboutiDominicaDominican RepublicEarly-demographic dividendEast Asia & PacificEast Asia & Pacific (excluding high income)East Asia & Pacific (IDA & IBRD countries)EcuadorEgypt, Arab Rep.El SalvadorEquatorial GuineaEritreaEstoniaEthiopiaEuro areaEurope & Central AsiaEurope & Central Asia (excluding high income)Europe & Central Asia (IDA & IBRD countries)European UnionFaroe IslandsFijiFinlandFragile and conflict affected situationsFranceFrench PolynesiaGabonGambia, TheGeorgiaGermanyGhanaGreeceGreenlandGrenadaGuatemalaGuineaGuinea-BissauGuyanaHaitiHeavily indebted poor countries (HIPC)High incomeHondurasHong Kong SAR, ChinaHungaryIBRD onlyIcelandIDA & IBRD totalIDA blendIDA onlyIDA totalIndiaIndonesiaIran, Islamic Rep.IraqIrelandIsraelItalyJamaicaJapanJordanKazakhstanKenyaKiribatiKorea, Rep.KuwaitKyrgyz RepublicLao PDRLate-demographic dividendLatin America & Caribbean Latin America & Caribbean (excluding high income)Latin America & the Caribbean (IDA & IBRD countries)LatviaLeast developed countries: UN classificationLebanonLesothoLiberiaLibyaLithuaniaLow & middle incomeLow incomeLower middle incomeLuxembourgMacao SAR, ChinaMacedonia, FYRMadagascarMalawiMalaysiaMaldivesMaliMaltaMauritaniaMauritiusMexicoMiddle East & North AfricaMiddle East & North Africa (excluding high income)Middle East & North Africa (IDA & IBRD countries)Middle incomeMoldovaMongoliaMoroccoMozambiqueMyanmarNamibiaNepalNetherlandsNew CaledoniaNew ZealandNicaraguaNigerNigeriaNorth AmericaNorwayOECD membersOmanOther small statesPacific island small statesPakistanPalauPanamaPapua New GuineaParaguayPeruPhilippinesPolandPortugalPost-demographic dividendPre-demographic dividendQatarRomaniaRussian FederationRwandaSamoaSao Tome and PrincipeSaudi ArabiaSenegalSerbiaSeychellesSierra LeoneSingaporeSlovak RepublicSloveniaSmall statesSolomon IslandsSomaliaSouth AfricaSouth AsiaSouth Asia (IDA & IBRD)SpainSri LankaSt. Kitts and NevisSt. LuciaSt. Vincent and the GrenadinesSub-Saharan Africa Sub-Saharan Africa (excluding high income)Sub-Saharan Africa (IDA & IBRD countries)SudanSurinameSwazilandSwedenSwitzerlandSyrian Arab RepublicTajikistanTanzaniaThailandTimor-LesteTogoTongaTrinidad and TobagoTunisiaTurkeyTurkmenistanTurks and Caicos IslandsTuvaluUgandaUkraineUnited Arab EmiratesUnited KingdomUnited StatesUpper middle incomeUruguayVanuatuVenezuela, RBVietnamVirgin Islands (U.S.)WorldYemen, Rep.ZambiaZimbabwe línea de tiempo (timeline):
En esta escala de tiempo se presenta un gráfico de 1963 y 2016 de Latin America & the Caribbean (IDA & IBRD countries). Los datos de 1962 están ausentes. El número de observaciones reales por fecha: 54.
Fuente (nombre):
Indicadores del desarrollo mundial
Fuente (organización):
World Bank staff estimates from the Comtrade database maintained by the United Nations Statistics Division.
Categorías:
Agriculture & Rural Development, Private Sector, Trade
Se ha actualizado:
23 abr 2017 año
Los indicadores de los cambios de valor en los últimos años
Mínimo:
0.974
1 ene 2014 año
Máximo:
4.678
1 ene 1966 año
A la fecha de observación
Valor
Cambio absoluto
El cambio con respecto al valor anterior
1 ene 1963 año
4.179
+4.179
0.0%
1 ene 1964 año
4.415
+0.237
5.66%
1 ene 1965 año
4.64
+0.224
5.08%
1 ene 1966 año
4.678
+0.039
0.84%
1 ene 1967 año
4.416
-0.262
-5.6%
1 ene 1968 año
4.297
-0.119
-2.7%
1 ene 1969 año
3.996
-0.301
-7.01%
1 ene 1970 año
4.036
+0.041
1.02%
1 ene 1971 año
3.709
-0.327
-8.11%
1 ene 1972 año
3.765
+0.056
1.5%
1 ene 1973 año
3.383
-0.381
-10.13%
1 ene 1974 año
3.479
+0.095
2.82%
1 ene 1975 año
3.506
+0.027
0.78%
1 ene 1976 año
2.617
-0.89
-25.37%
1 ene 1977 año
2.81
+0.193
7.39%
1 ene 1978 año
2.824
+0.014
0.51%
1 ene 1979 año
2.658
-0.166
-5.88%
1 ene 1980 año
2.687
+0.029
1.08%
1 ene 1981 año
2.342
-0.345
-12.85%
1 ene 1982 año
1.937
-0.404
-17.27%
1 ene 1983 año
2.241
+0.304
15.67%
1 ene 1984 año
2.738
+0.497
22.19%
1 ene 1985 año
3.166
+0.428
15.63%
1 ene 1986 año
3.008
-0.158
-4.98%
1 ene 1987 año
3.271
+0.262
8.71%
1 ene 1988 año
4.22
+0.949
29.02%
1 ene 1989 año
3.779
-0.441
-10.45%
1 ene 1990 año
3.557
-0.221
-5.86%
1 ene 1991 año
2.935
-0.623
-17.5%
1 ene 1992 año
2.679
-0.256
-8.71%
1 ene 1993 año
2.277
-0.402
-15.02%
1 ene 1994 año
2.575
+0.298
13.08%
1 ene 1995 año
2.269
-0.306
-11.87%
1 ene 1996 año
2.341
+0.072
3.15%
1 ene 1997 año
2.128
-0.212
-9.08%
1 ene 1998 año
1.921
-0.208
-9.76%
1 ene 1999 año
1.746
-0.175
-9.09%
1 ene 2000 año
1.641
-0.105
-5.99%
1 ene 2001 año
1.645
+0.004
0.23%
1 ene 2002 año
1.439
-0.206
-12.55%
1 ene 2003 año
1.532
+0.093
6.46%
1 ene 2004 año
1.675
+0.143
9.33%
1 ene 2005 año
1.57
-0.105
-6.27%
1 ene 2006 año
1.402
-0.168
-10.71%
1 ene 2007 año
1.331
-0.071
-5.07%
1 ene 2008 año
1.236
-0.094
-7.1%
1 ene 2009 año
1.164
-0.072
-5.85%
1 ene 2010 año
1.124
-0.04
-3.41%
1 ene 2011 año
1.216
+0.092
8.19%
1 ene 2012 año
1.252
+0.036
2.96%
1 ene 2013 año
1.042
-0.21
-16.8%
1 ene 2014 año
0.974
-0.068
-6.51%
1 ene 2015 año
0.983
+0.009
0.9%
1 ene 2016 año
0.996
+0.014
1.4%
Ranking de los países por los datos estadísticos actuales


Comentarios: