29
/es/
es
AIzaSyAYiBZKx7MnpbEhh9jyipgxe19OcubqV5w
April 1, 2024
266539
Trinidad and Tobago
TTO
true
2
1
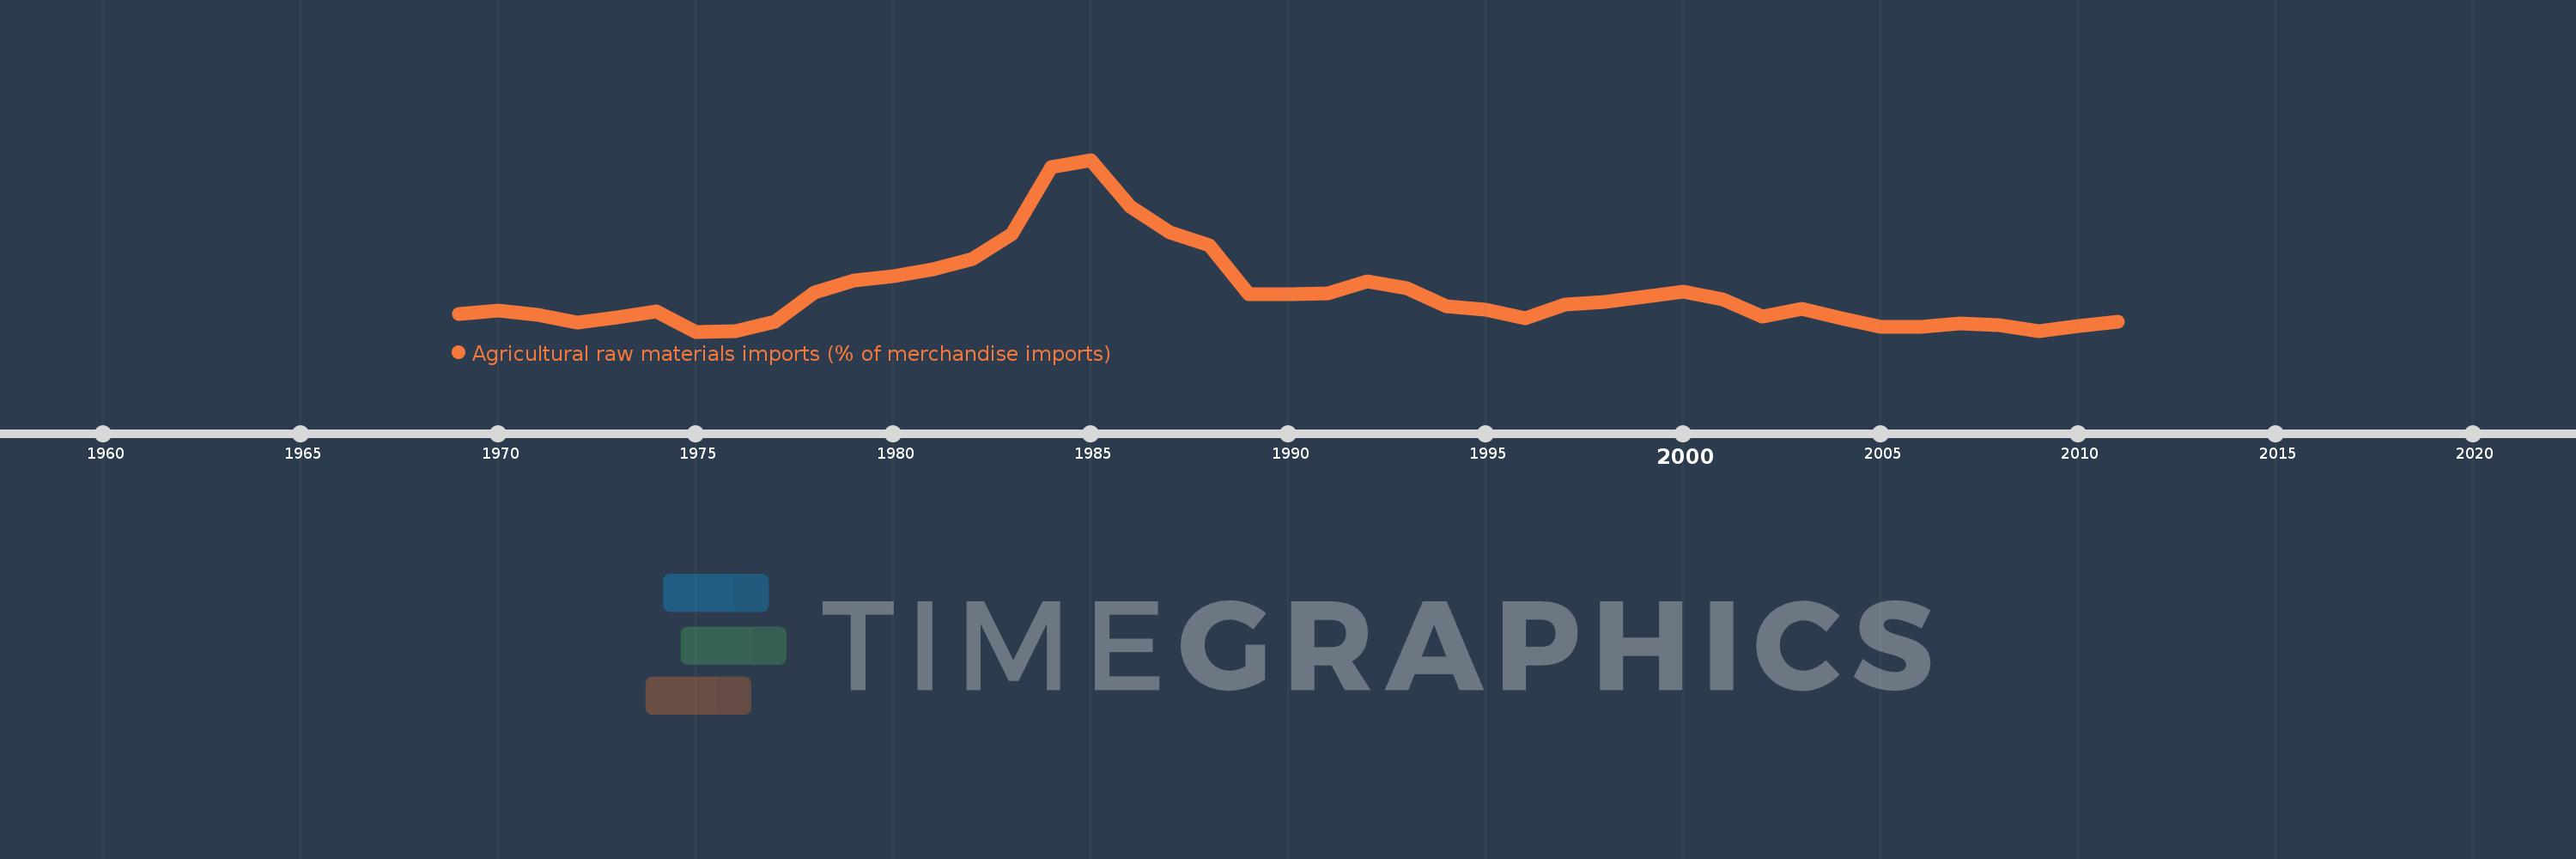
Agricultural raw materials imports (% of merchandise imports)
2011,2010,2009,2008,2007,2006,2005,2004,2003,2002,2001,2000,1999,1998,1997,1996,1995,1994,1993,1992,1991,1990,1989,1988,1987,1986,1985,1984,1983,1982,1981,1980,1979,1978,1977,1976,1975,1974,1973,1972,1971,1970,1969
Estas estadísticas en otros países:
AfghanistanAlbaniaAlgeriaAndorraAngolaAntigua and BarbudaArab WorldArgentinaArmeniaArubaAustraliaAustriaAzerbaijanBahamas, TheBahrainBangladeshBarbadosBelarusBelgiumBelizeBeninBermudaBhutanBoliviaBosnia and HerzegovinaBotswanaBrazilBrunei DarussalamBulgariaBurkina FasoBurundiCabo VerdeCambodiaCameroonCanadaCaribbean small statesCayman IslandsCentral African RepublicCentral Europe and the BalticsChadChileChinaColombiaComorosCongo, Dem. Rep.Congo, Rep.Costa RicaCote d'IvoireCroatiaCubaCyprusCzech RepublicDenmarkDjiboutiDominicaDominican RepublicEarly-demographic dividendEast Asia & PacificEast Asia & Pacific (excluding high income)East Asia & Pacific (IDA & IBRD countries)EcuadorEgypt, Arab Rep.El SalvadorEquatorial GuineaEritreaEstoniaEthiopiaEuro areaEurope & Central AsiaEurope & Central Asia (excluding high income)Europe & Central Asia (IDA & IBRD countries)European UnionFaroe IslandsFijiFinlandFragile and conflict affected situationsFranceFrench PolynesiaGabonGambia, TheGeorgiaGermanyGhanaGreeceGreenlandGrenadaGuatemalaGuineaGuinea-BissauGuyanaHaitiHeavily indebted poor countries (HIPC)High incomeHondurasHong Kong SAR, ChinaHungaryIBRD onlyIcelandIDA & IBRD totalIDA blendIDA onlyIDA totalIndiaIndonesiaIran, Islamic Rep.IraqIrelandIsraelItalyJamaicaJapanJordanKazakhstanKenyaKiribatiKorea, Rep.KuwaitKyrgyz RepublicLao PDRLate-demographic dividendLatin America & Caribbean Latin America & Caribbean (excluding high income)Latin America & the Caribbean (IDA & IBRD countries)LatviaLeast developed countries: UN classificationLebanonLesothoLiberiaLibyaLithuaniaLow & middle incomeLow incomeLower middle incomeLuxembourgMacao SAR, ChinaMacedonia, FYRMadagascarMalawiMalaysiaMaldivesMaliMaltaMauritaniaMauritiusMexicoMiddle East & North AfricaMiddle East & North Africa (excluding high income)Middle East & North Africa (IDA & IBRD countries)Middle incomeMoldovaMongoliaMoroccoMozambiqueMyanmarNamibiaNepalNetherlandsNew CaledoniaNew ZealandNicaraguaNigerNigeriaNorth AmericaNorwayOECD membersOmanOther small statesPacific island small statesPakistanPalauPanamaPapua New GuineaParaguayPeruPhilippinesPolandPortugalPost-demographic dividendPre-demographic dividendQatarRomaniaRussian FederationRwandaSamoaSao Tome and PrincipeSaudi ArabiaSenegalSerbiaSeychellesSierra LeoneSingaporeSlovak RepublicSloveniaSmall statesSolomon IslandsSomaliaSouth AfricaSouth AsiaSouth Asia (IDA & IBRD)SpainSri LankaSt. Kitts and NevisSt. LuciaSt. Vincent and the GrenadinesSub-Saharan Africa Sub-Saharan Africa (excluding high income)Sub-Saharan Africa (IDA & IBRD countries)SudanSurinameSwazilandSwedenSwitzerlandSyrian Arab RepublicTajikistanTanzaniaThailandTimor-LesteTogoTongaTrinidad and TobagoTunisiaTurkeyTurkmenistanTurks and Caicos IslandsTuvaluUgandaUkraineUnited Arab EmiratesUnited KingdomUnited StatesUpper middle incomeUruguayVanuatuVenezuela, RBVietnamVirgin Islands (U.S.)WorldYemen, Rep.ZambiaZimbabwe línea de tiempo (timeline):
En esta escala de tiempo se presenta un gráfico de 1969 y 2011 de Trinidad and Tobago. Los datos de 1968 están ausentes. El número de observaciones reales por fecha: 43.
Fuente (nombre):
Indicadores del desarrollo mundial
Fuente (organización):
World Bank staff estimates from the Comtrade database maintained by the United Nations Statistics Division.
Categorías:
Agriculture & Rural Development, Private Sector, Trade
Se ha actualizado:
23 abr 2017 año
Los indicadores de los cambios de valor en los últimos años
Mínimo:
0.475
1 ene 1975 año
Máximo:
3.382
1 ene 1985 año
A la fecha de observación
Valor
Cambio absoluto
El cambio con respecto al valor anterior
1 ene 1969 año
0.772
+0.772
0.0%
1 ene 1970 año
0.825
+0.053
6.91%
1 ene 1971 año
0.755
-0.07
-8.47%
1 ene 1972 año
0.625
-0.13
-17.24%
1 ene 1973 año
0.713
+0.088
14.15%
1 ene 1974 año
0.822
+0.109
15.21%
1 ene 1975 año
0.475
-0.347
-42.23%
1 ene 1976 año
0.479
+0.004
0.94%
1 ene 1977 año
0.649
+0.17
35.44%
1 ene 1978 año
1.137
+0.488
75.13%
1 ene 1979 año
1.342
+0.206
18.08%
1 ene 1980 año
1.418
+0.076
5.65%
1 ene 1981 año
1.53
+0.112
7.92%
1 ene 1982 año
1.704
+0.174
11.35%
1 ene 1983 año
2.13
+0.426
24.97%
1 ene 1984 año
3.254
+1.124
52.77%
1 ene 1985 año
3.382
+0.129
3.96%
1 ene 1986 año
2.591
-0.791
-23.4%
1 ene 1987 año
2.151
-0.44
-16.97%
1 ene 1988 año
1.93
-0.222
-10.3%
1 ene 1989 año
1.109
-0.82
-42.52%
1 ene 1990 año
1.108
-0.001
-0.07%
1 ene 1991 año
1.125
+0.016
1.47%
1 ene 1992 año
1.328
+0.203
18.03%
1 ene 1993 año
1.204
-0.123
-9.28%
1 ene 1994 año
0.909
-0.295
-24.5%
1 ene 1995 año
0.847
-0.062
-6.84%
1 ene 1996 año
0.694
-0.153
-18.05%
1 ene 1997 año
0.928
+0.234
33.7%
1 ene 1998 año
0.981
+0.053
5.7%
1 ene 1999 año
1.063
+0.082
8.35%
1 ene 2000 año
1.155
+0.092
8.62%
1 ene 2001 año
1.013
-0.141
-12.24%
1 ene 2002 año
0.731
-0.282
-27.84%
1 ene 2003 año
0.865
+0.133
18.25%
1 ene 2004 año
0.707
-0.158
-18.28%
1 ene 2005 año
0.559
-0.147
-20.85%
1 ene 2006 año
0.562
+0.003
0.56%
1 ene 2007 año
0.619
+0.057
10.12%
1 ene 2008 año
0.58
-0.039
-6.36%
1 ene 2009 año
0.486
-0.094
-16.15%
1 ene 2010 año
0.571
+0.085
17.48%
1 ene 2011 año
0.649
+0.078
13.68%
Ranking de los países por los datos estadísticos actuales


Comentarios: