29
/es/
es
AIzaSyAYiBZKx7MnpbEhh9jyipgxe19OcubqV5w
April 1, 2024
79697
Barbados
BRB
true
2
1
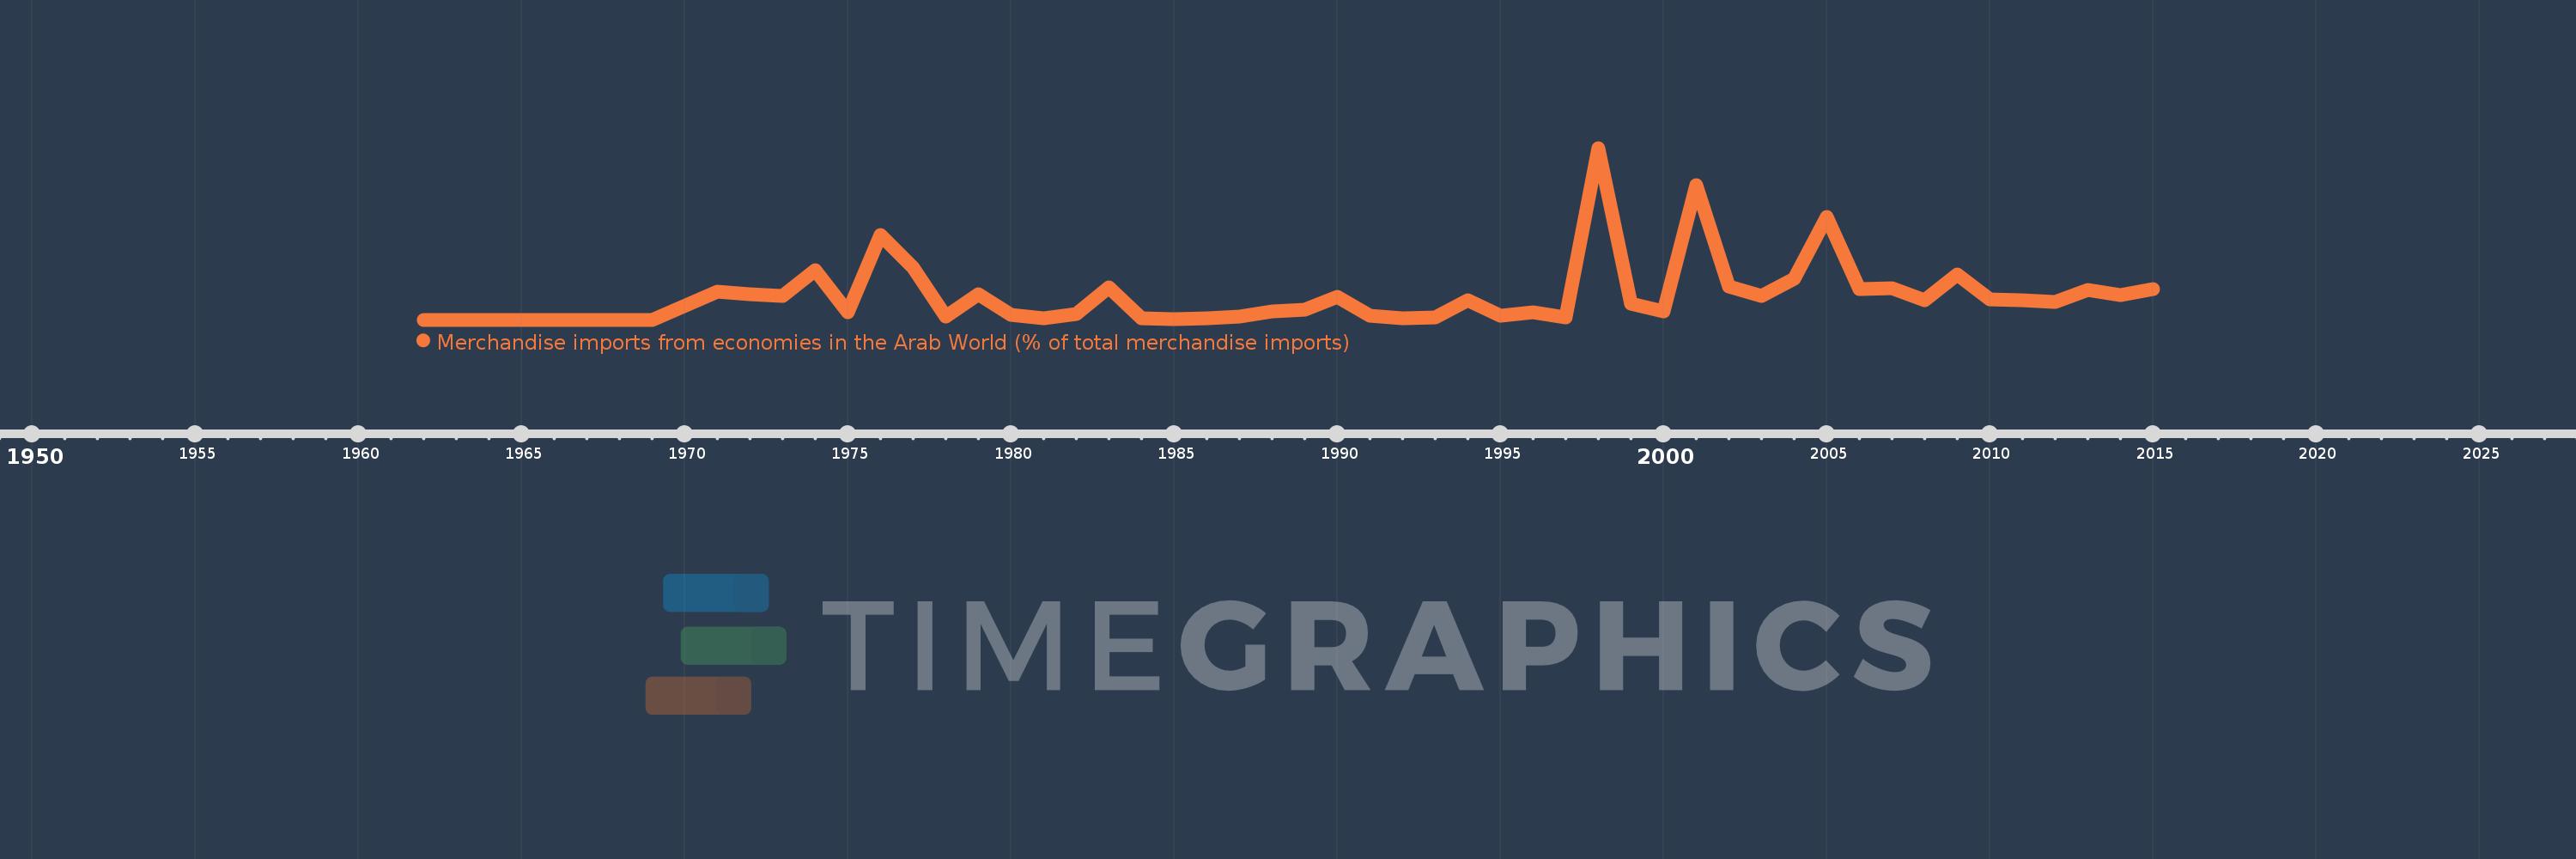
Merchandise imports from economies in the Arab World (% of total merchandise imports)
2015,2014,2013,2012,2011,2010,2009,2008,2007,2006,2005,2004,2003,2002,2001,2000,1999,1998,1997,1996,1995,1994,1993,1992,1991,1990,1989,1988,1987,1986,1985,1984,1983,1982,1981,1980,1979,1978,1977,1976,1975,1974,1973,1972,1971,1969,1968,1967,1966,1965,1964,1963,1962
Estas estadísticas en otros países:
AfghanistanAlbaniaAlgeriaAngolaArab WorldArgentinaArmeniaArubaAustraliaAustriaAzerbaijanBahamas, TheBahrainBangladeshBarbadosBelarusBelgiumBelizeBeninBermudaBoliviaBrazilBrunei DarussalamBulgariaBurkina FasoBurundiCabo VerdeCambodiaCameroonCanadaCaribbean small statesCentral African RepublicCentral Europe and the BalticsChadChileChinaColombiaComorosCongo, Dem. Rep.Congo, Rep.Costa RicaCote d'IvoireCroatiaCubaCyprusCzech RepublicDenmarkDjiboutiDominicaDominican RepublicEarly-demographic dividendEast Asia & PacificEast Asia & Pacific (excluding high income)East Asia & Pacific (IDA & IBRD countries)EcuadorEgypt, Arab Rep.El SalvadorEstoniaEthiopiaEuro areaEurope & Central AsiaEurope & Central Asia (excluding high income)Europe & Central Asia (IDA & IBRD countries)European UnionFijiFinlandFragile and conflict affected situationsFranceFrench PolynesiaGabonGambia, TheGeorgiaGermanyGhanaGreeceGreenlandGrenadaGuatemalaGuineaGuinea-BissauGuyanaHaitiHeavily indebted poor countries (HIPC)High incomeHondurasHong Kong SAR, ChinaHungaryIBRD onlyIcelandIDA & IBRD totalIDA blendIDA onlyIDA totalIndiaIndonesiaIran, Islamic Rep.IraqIrelandItalyJamaicaJapanJordanKazakhstanKenyaKorea, Dem. People’s Rep.Korea, Rep.KuwaitKyrgyz RepublicLao PDRLate-demographic dividendLatin America & Caribbean Latin America & Caribbean (excluding high income)Latin America & the Caribbean (IDA & IBRD countries)LatviaLeast developed countries: UN classificationLebanonLiberiaLibyaLithuaniaLow & middle incomeLow incomeLower middle incomeLuxembourgMacao SAR, ChinaMacedonia, FYRMadagascarMalawiMalaysiaMaldivesMaliMaltaMauritaniaMauritiusMexicoMiddle East & North AfricaMiddle East & North Africa (excluding high income)Middle East & North Africa (IDA & IBRD countries)Middle incomeMoldovaMongoliaMontenegroMoroccoMozambiqueMyanmarNepalNetherlandsNew CaledoniaNew ZealandNicaraguaNigerNigeriaNorth AmericaNorwayOECD membersOmanOther small statesPacific island small statesPakistanPanamaPapua New GuineaParaguayPeruPhilippinesPolandPortugalPost-demographic dividendPre-demographic dividendQatarRomaniaRussian FederationRwandaSaudi ArabiaSenegalSerbiaSeychellesSierra LeoneSingaporeSlovak RepublicSloveniaSmall statesSomaliaSouth AfricaSouth AsiaSouth Asia (IDA & IBRD)SpainSri LankaSt. LuciaSt. Vincent and the GrenadinesSub-Saharan Africa Sub-Saharan Africa (excluding high income)Sub-Saharan Africa (IDA & IBRD countries)SudanSurinameSwedenSwitzerlandSyrian Arab RepublicTajikistanTanzaniaThailandTogoTrinidad and TobagoTunisiaTurkeyTurkmenistanUgandaUkraineUnited Arab EmiratesUnited KingdomUnited StatesUpper middle incomeUruguayVenezuela, RBVietnamWorldYemen, Rep.ZambiaZimbabwe línea de tiempo (timeline):
En esta escala de tiempo se presenta un gráfico de 1962 y 2015 de Barbados. Los datos de 1961 están ausentes. El número de observaciones reales por fecha: 53.
Fuente (nombre):
Indicadores del desarrollo mundial
Fuente (organización):
World Bank staff estimates based data from International Monetary Fund's Direction of Trade database.
Categorías:
Private Sector, Trade
Se ha actualizado:
23 abr 2017 año
Los indicadores de los cambios de valor en los últimos años
Máximo:
0.216
1 ene 1998 año
A la fecha de observación
Valor
Cambio absoluto
El cambio con respecto al valor anterior
1 ene 1962 año
0.0
0.0
0.0%
1 ene 1971 año
0.035
+0.035
%
1 ene 1972 año
0.032
-0.002
-6.18%
1 ene 1973 año
0.03
-0.003
-8.55%
1 ene 1974 año
0.062
+0.032
107.96%
1 ene 1975 año
0.009
-0.053
-85.71%
1 ene 1976 año
0.107
+0.099
1.12 mil%
1 ene 1977 año
0.066
-0.042
-38.68%
1 ene 1978 año
0.004
-0.062
-94.45%
1 ene 1979 año
0.032
+0.029
783.51%
1 ene 1980 año
0.006
-0.026
-81.76%
1 ene 1981 año
0.002
-0.004
-60.3%
1 ene 1982 año
0.007
+0.004
192.11%
1 ene 1983 año
0.041
+0.034
495.57%
1 ene 1984 año
0.002
-0.038
-94.5%
1 ene 1985 año
0.001
-0.001
-66.01%
1 ene 1986 año
0.002
+0.001
181.23%
1 ene 1987 año
0.004
+0.002
90.96%
1 ene 1988 año
0.01
+0.006
147.2%
1 ene 1989 año
0.013
+0.003
26.49%
1 ene 1990 año
0.029
+0.016
128.55%
1 ene 1991 año
0.005
-0.024
-81.41%
1 ene 1992 año
0.002
-0.003
-55.4%
1 ene 1993 año
0.003
+0.0
19.47%
1 ene 1994 año
0.024
+0.021
730.84%
1 ene 1995 año
0.005
-0.019
-77.65%
1 ene 1996 año
0.009
+0.004
74.0%
1 ene 1997 año
0.003
-0.007
-70.31%
1 ene 1998 año
0.216
+0.213
7.67 mil%
1 ene 1999 año
0.02
-0.196
-90.66%
1 ene 2000 año
0.01
-0.011
-52.68%
1 ene 2001 año
0.169
+0.159
1.67 mil%
1 ene 2002 año
0.042
-0.126
-75.01%
1 ene 2003 año
0.03
-0.012
-28.1%
1 ene 2004 año
0.052
+0.022
71.92%
1 ene 2005 año
0.129
+0.077
147.75%
1 ene 2006 año
0.039
-0.09
-69.63%
1 ene 2007 año
0.04
+0.001
2.83%
1 ene 2008 año
0.024
-0.017
-40.96%
1 ene 2009 año
0.057
+0.033
138.57%
1 ene 2010 año
0.026
-0.031
-55.01%
1 ene 2011 año
0.024
-0.001
-4.19%
1 ene 2012 año
0.022
-0.002
-9.99%
1 ene 2013 año
0.037
+0.015
67.66%
1 ene 2014 año
0.031
-0.006
-17.13%
1 ene 2015 año
0.039
+0.008
26.05%
Ranking de los países por los datos estadísticos actuales


Comentarios: