29
/es/
es
AIzaSyAYiBZKx7MnpbEhh9jyipgxe19OcubqV5w
April 1, 2024
123789
Ecuador
ECU
true
2
1
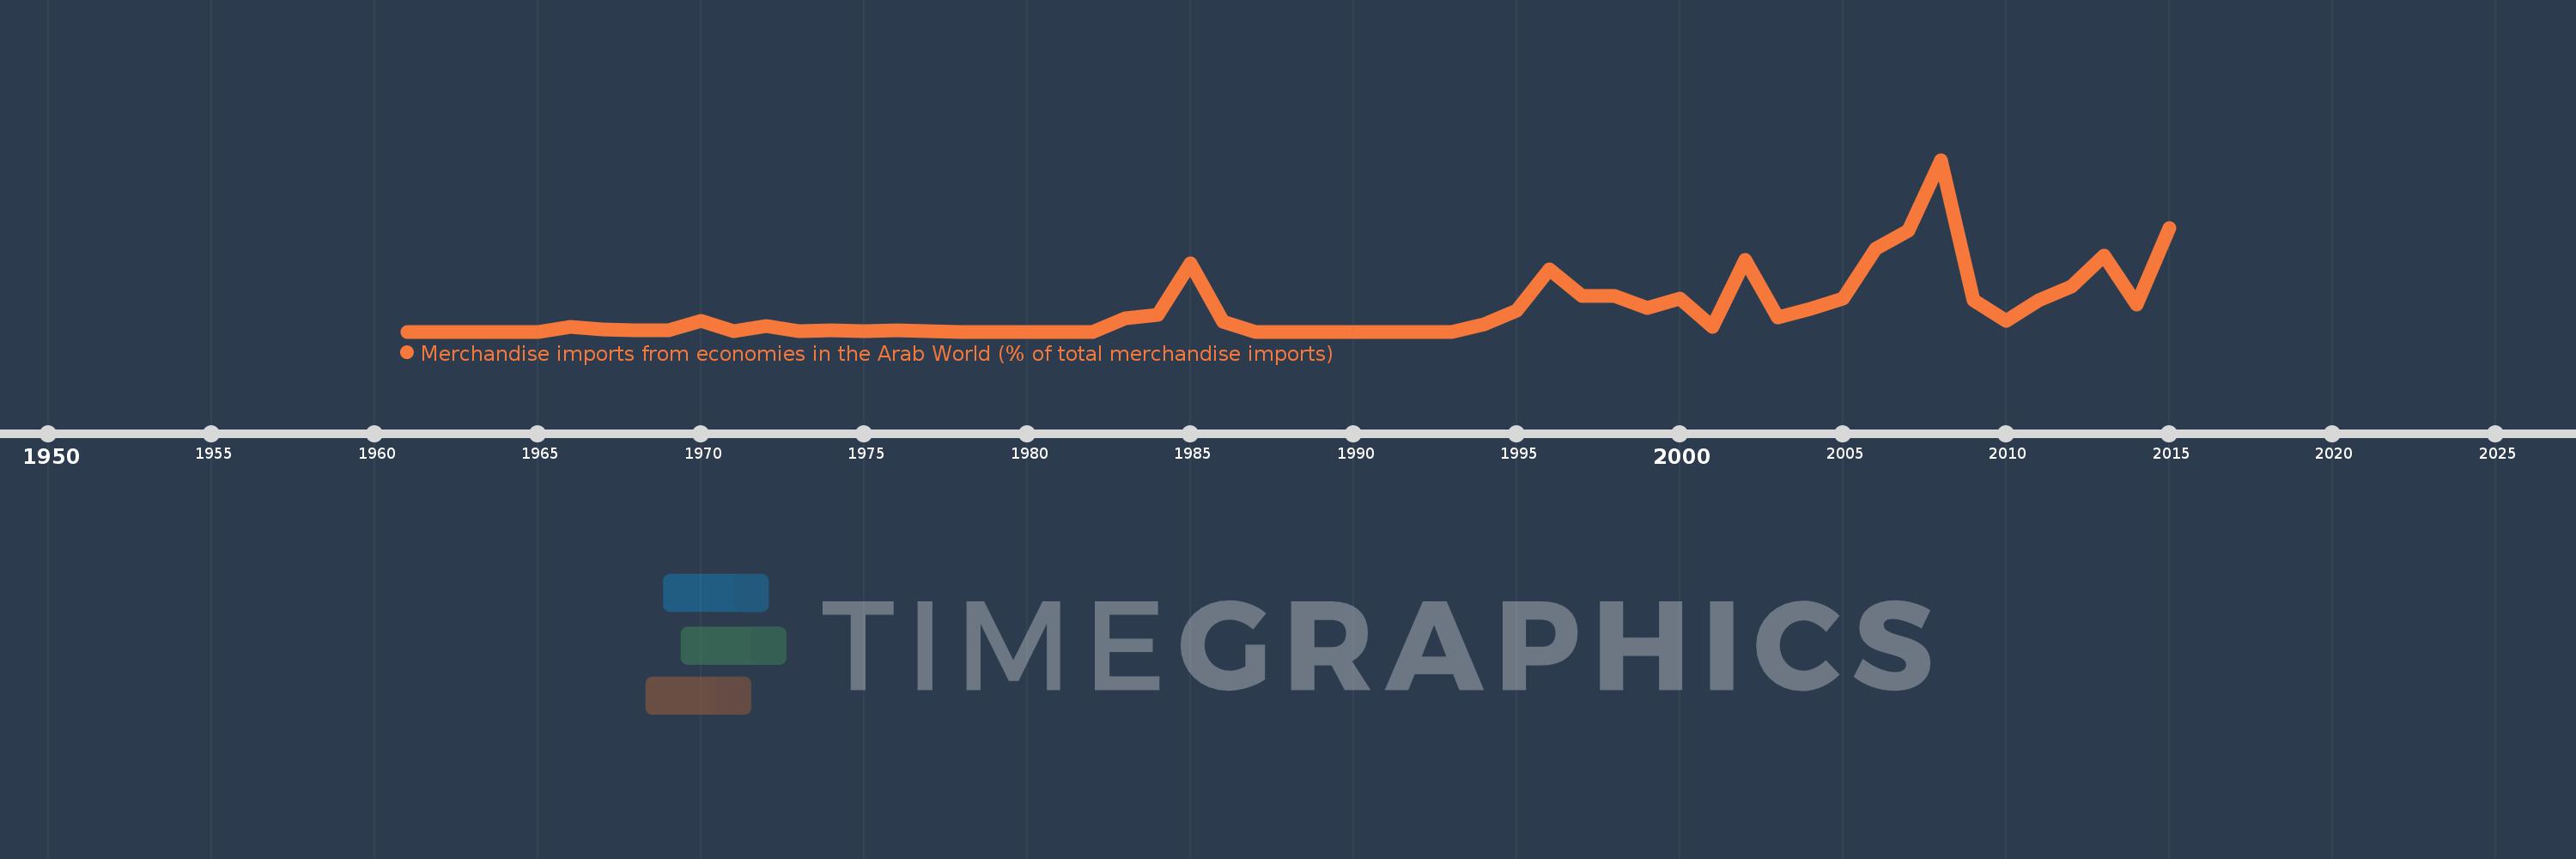
Merchandise imports from economies in the Arab World (% of total merchandise imports)
2015,2014,2013,2012,2011,2010,2009,2008,2007,2006,2005,2004,2003,2002,2001,2000,1999,1998,1997,1996,1995,1994,1993,1992,1991,1990,1989,1988,1987,1986,1985,1984,1983,1982,1981,1980,1979,1978,1977,1976,1975,1974,1973,1972,1971,1970,1969,1968,1967,1966,1965,1964,1963,1962,1961
Estas estadísticas en otros países:
AfghanistanAlbaniaAlgeriaAngolaArab WorldArgentinaArmeniaArubaAustraliaAustriaAzerbaijanBahamas, TheBahrainBangladeshBarbadosBelarusBelgiumBelizeBeninBermudaBoliviaBrazilBrunei DarussalamBulgariaBurkina FasoBurundiCabo VerdeCambodiaCameroonCanadaCaribbean small statesCentral African RepublicCentral Europe and the BalticsChadChileChinaColombiaComorosCongo, Dem. Rep.Congo, Rep.Costa RicaCote d'IvoireCroatiaCubaCyprusCzech RepublicDenmarkDjiboutiDominicaDominican RepublicEarly-demographic dividendEast Asia & PacificEast Asia & Pacific (excluding high income)East Asia & Pacific (IDA & IBRD countries)EcuadorEgypt, Arab Rep.El SalvadorEstoniaEthiopiaEuro areaEurope & Central AsiaEurope & Central Asia (excluding high income)Europe & Central Asia (IDA & IBRD countries)European UnionFijiFinlandFragile and conflict affected situationsFranceFrench PolynesiaGabonGambia, TheGeorgiaGermanyGhanaGreeceGreenlandGrenadaGuatemalaGuineaGuinea-BissauGuyanaHaitiHeavily indebted poor countries (HIPC)High incomeHondurasHong Kong SAR, ChinaHungaryIBRD onlyIcelandIDA & IBRD totalIDA blendIDA onlyIDA totalIndiaIndonesiaIran, Islamic Rep.IraqIrelandItalyJamaicaJapanJordanKazakhstanKenyaKorea, Dem. People’s Rep.Korea, Rep.KuwaitKyrgyz RepublicLao PDRLate-demographic dividendLatin America & Caribbean Latin America & Caribbean (excluding high income)Latin America & the Caribbean (IDA & IBRD countries)LatviaLeast developed countries: UN classificationLebanonLiberiaLibyaLithuaniaLow & middle incomeLow incomeLower middle incomeLuxembourgMacao SAR, ChinaMacedonia, FYRMadagascarMalawiMalaysiaMaldivesMaliMaltaMauritaniaMauritiusMexicoMiddle East & North AfricaMiddle East & North Africa (excluding high income)Middle East & North Africa (IDA & IBRD countries)Middle incomeMoldovaMongoliaMontenegroMoroccoMozambiqueMyanmarNepalNetherlandsNew CaledoniaNew ZealandNicaraguaNigerNigeriaNorth AmericaNorwayOECD membersOmanOther small statesPacific island small statesPakistanPanamaPapua New GuineaParaguayPeruPhilippinesPolandPortugalPost-demographic dividendPre-demographic dividendQatarRomaniaRussian FederationRwandaSaudi ArabiaSenegalSerbiaSeychellesSierra LeoneSingaporeSlovak RepublicSloveniaSmall statesSomaliaSouth AfricaSouth AsiaSouth Asia (IDA & IBRD)SpainSri LankaSt. LuciaSt. Vincent and the GrenadinesSub-Saharan Africa Sub-Saharan Africa (excluding high income)Sub-Saharan Africa (IDA & IBRD countries)SudanSurinameSwedenSwitzerlandSyrian Arab RepublicTajikistanTanzaniaThailandTogoTrinidad and TobagoTunisiaTurkeyTurkmenistanUgandaUkraineUnited Arab EmiratesUnited KingdomUnited StatesUpper middle incomeUruguayVenezuela, RBVietnamWorldYemen, Rep.ZambiaZimbabwe línea de tiempo (timeline):
En esta escala de tiempo se presenta un gráfico de 1961 y 2015 de Ecuador. Los datos de 1960 están ausentes. El número de observaciones reales por fecha: 55.
Fuente (nombre):
Indicadores del desarrollo mundial
Fuente (organización):
World Bank staff estimates based data from International Monetary Fund's Direction of Trade database.
Categorías:
Private Sector, Trade
Se ha actualizado:
23 abr 2017 año
Los indicadores de los cambios de valor en los últimos años
Máximo:
1.563
1 ene 2008 año
A la fecha de observación
Valor
Cambio absoluto
El cambio con respecto al valor anterior
1 ene 1961 año
0.0
0.0
0.0%
1 ene 1966 año
0.042
+0.042
%
1 ene 1967 año
0.017
-0.025
-59.29%
1 ene 1968 año
0.009
-0.008
-45.81%
1 ene 1969 año
0.008
-0.002
-16.15%
1 ene 1970 año
0.099
+0.091
1.17 mil%
1 ene 1971 año
0.007
-0.092
-92.64%
1 ene 1972 año
0.053
+0.045
622.28%
1 ene 1973 año
0.003
-0.05
-94.05%
1 ene 1974 año
0.01
+0.007
220.86%
1 ene 1975 año
0.004
-0.006
-56.08%
1 ene 1976 año
0.011
+0.007
149.89%
1 ene 1977 año
0.004
-0.007
-62.64%
1 ene 1978 año
0.0
-0.004
-100.0%
1 ene 1983 año
0.12
+0.12
%
1 ene 1984 año
0.152
+0.031
26.04%
1 ene 1985 año
0.621
+0.47
310.04%
1 ene 1986 año
0.09
-0.531
-85.53%
1 ene 1987 año
0.0
-0.09
-100.0%
1 ene 1994 año
0.068
+0.068
%
1 ene 1995 año
0.19
+0.122
178.81%
1 ene 1996 año
0.565
+0.375
197.49%
1 ene 1997 año
0.321
-0.244
-43.17%
1 ene 1998 año
0.325
+0.003
1.09%
1 ene 1999 año
0.212
-0.112
-34.59%
1 ene 2000 año
0.3
+0.088
41.22%
1 ene 2001 año
0.043
-0.257
-85.77%
1 ene 2002 año
0.654
+0.612
1.43 mil%
1 ene 2003 año
0.126
-0.528
-80.77%
1 ene 2004 año
0.207
+0.081
64.4%
1 ene 2005 año
0.302
+0.095
46.06%
1 ene 2006 año
0.756
+0.453
150.09%
1 ene 2007 año
0.916
+0.161
21.27%
1 ene 2008 año
1.563
+0.646
70.54%
1 ene 2009 año
0.288
-1.275
-81.57%
1 ene 2010 año
0.1
-0.188
-65.44%
1 ene 2011 año
0.282
+0.182
183.3%
1 ene 2012 año
0.41
+0.128
45.35%
1 ene 2013 año
0.695
+0.285
69.67%
1 ene 2014 año
0.249
-0.446
-64.15%
1 ene 2015 año
0.944
+0.695
278.85%
Ranking de los países por los datos estadísticos actuales


Comentarios: