29
/es/
es
AIzaSyAYiBZKx7MnpbEhh9jyipgxe19OcubqV5w
April 1, 2024
30896
Europe & Central Asia
ECS
false
2
1
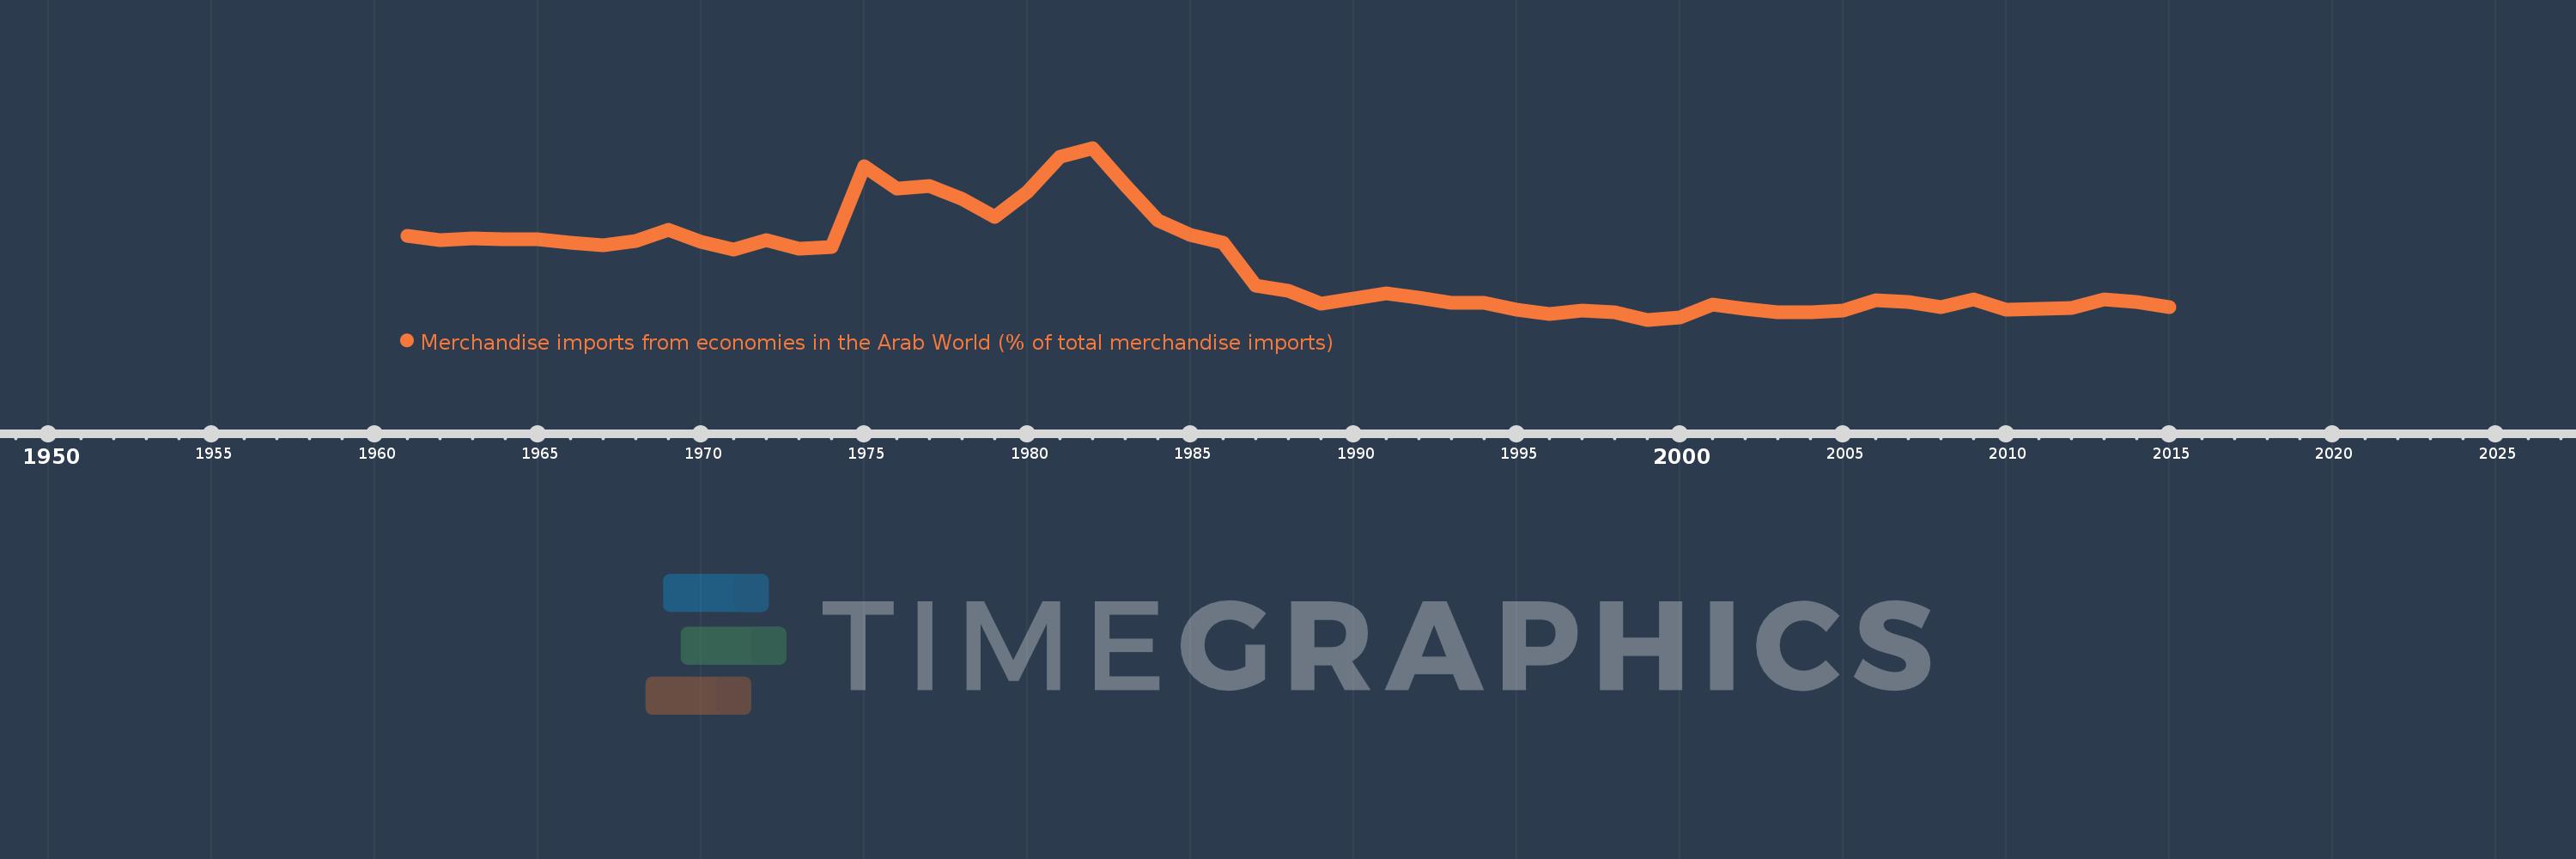
Merchandise imports from economies in the Arab World (% of total merchandise imports)
2015,2014,2013,2012,2011,2010,2009,2008,2007,2006,2005,2004,2003,2002,2001,2000,1999,1998,1997,1996,1995,1994,1993,1992,1991,1990,1989,1988,1987,1986,1985,1984,1983,1982,1981,1980,1979,1978,1977,1976,1975,1974,1973,1972,1971,1970,1969,1968,1967,1966,1965,1964,1963,1962,1961
Estas estadísticas en otros países:
AfghanistanAlbaniaAlgeriaAngolaArab WorldArgentinaArmeniaArubaAustraliaAustriaAzerbaijanBahamas, TheBahrainBangladeshBarbadosBelarusBelgiumBelizeBeninBermudaBoliviaBrazilBrunei DarussalamBulgariaBurkina FasoBurundiCabo VerdeCambodiaCameroonCanadaCaribbean small statesCentral African RepublicCentral Europe and the BalticsChadChileChinaColombiaComorosCongo, Dem. Rep.Congo, Rep.Costa RicaCote d'IvoireCroatiaCubaCyprusCzech RepublicDenmarkDjiboutiDominicaDominican RepublicEarly-demographic dividendEast Asia & PacificEast Asia & Pacific (excluding high income)East Asia & Pacific (IDA & IBRD countries)EcuadorEgypt, Arab Rep.El SalvadorEstoniaEthiopiaEuro areaEurope & Central AsiaEurope & Central Asia (excluding high income)Europe & Central Asia (IDA & IBRD countries)European UnionFijiFinlandFragile and conflict affected situationsFranceFrench PolynesiaGabonGambia, TheGeorgiaGermanyGhanaGreeceGreenlandGrenadaGuatemalaGuineaGuinea-BissauGuyanaHaitiHeavily indebted poor countries (HIPC)High incomeHondurasHong Kong SAR, ChinaHungaryIBRD onlyIcelandIDA & IBRD totalIDA blendIDA onlyIDA totalIndiaIndonesiaIran, Islamic Rep.IraqIrelandItalyJamaicaJapanJordanKazakhstanKenyaKorea, Dem. People’s Rep.Korea, Rep.KuwaitKyrgyz RepublicLao PDRLate-demographic dividendLatin America & Caribbean Latin America & Caribbean (excluding high income)Latin America & the Caribbean (IDA & IBRD countries)LatviaLeast developed countries: UN classificationLebanonLiberiaLibyaLithuaniaLow & middle incomeLow incomeLower middle incomeLuxembourgMacao SAR, ChinaMacedonia, FYRMadagascarMalawiMalaysiaMaldivesMaliMaltaMauritaniaMauritiusMexicoMiddle East & North AfricaMiddle East & North Africa (excluding high income)Middle East & North Africa (IDA & IBRD countries)Middle incomeMoldovaMongoliaMontenegroMoroccoMozambiqueMyanmarNepalNetherlandsNew CaledoniaNew ZealandNicaraguaNigerNigeriaNorth AmericaNorwayOECD membersOmanOther small statesPacific island small statesPakistanPanamaPapua New GuineaParaguayPeruPhilippinesPolandPortugalPost-demographic dividendPre-demographic dividendQatarRomaniaRussian FederationRwandaSaudi ArabiaSenegalSerbiaSeychellesSierra LeoneSingaporeSlovak RepublicSloveniaSmall statesSomaliaSouth AfricaSouth AsiaSouth Asia (IDA & IBRD)SpainSri LankaSt. LuciaSt. Vincent and the GrenadinesSub-Saharan Africa Sub-Saharan Africa (excluding high income)Sub-Saharan Africa (IDA & IBRD countries)SudanSurinameSwedenSwitzerlandSyrian Arab RepublicTajikistanTanzaniaThailandTogoTrinidad and TobagoTunisiaTurkeyTurkmenistanUgandaUkraineUnited Arab EmiratesUnited KingdomUnited StatesUpper middle incomeUruguayVenezuela, RBVietnamWorldYemen, Rep.ZambiaZimbabwe línea de tiempo (timeline):
En esta escala de tiempo se presenta un gráfico de 1961 y 2015 de Europe & Central Asia. Los datos de 1960 están ausentes. El número de observaciones reales por fecha: 55.
Fuente (nombre):
Indicadores del desarrollo mundial
Fuente (organización):
World Bank staff estimates based data from International Monetary Fund's Direction of Trade database.
Categorías:
Private Sector, Trade
Se ha actualizado:
23 abr 2017 año
Los indicadores de los cambios de valor en los últimos años
Mínimo:
1.998
1 ene 1999 año
Máximo:
11.811
1 ene 1982 año
A la fecha de observación
Valor
Cambio absoluto
El cambio con respecto al valor anterior
1 ene 1961 año
6.808
+6.808
0.0%
1 ene 1962 año
6.523
-0.284
-4.17%
1 ene 1963 año
6.644
+0.121
1.85%
1 ene 1964 año
6.604
-0.04
-0.6%
1 ene 1965 año
6.573
-0.031
-0.47%
1 ene 1966 año
6.392
-0.181
-2.75%
1 ene 1967 año
6.275
-0.117
-1.83%
1 ene 1968 año
6.504
+0.229
3.66%
1 ene 1969 año
7.148
+0.644
9.9%
1 ene 1970 año
6.468
-0.68
-9.52%
1 ene 1971 año
5.994
-0.473
-7.32%
1 ene 1972 año
6.547
+0.553
9.22%
1 ene 1973 año
6.08
-0.467
-7.13%
1 ene 1974 año
6.174
+0.093
1.53%
1 ene 1975 año
10.747
+4.573
74.07%
1 ene 1976 año
9.499
-1.248
-11.61%
1 ene 1977 año
9.613
+0.115
1.21%
1 ene 1978 año
8.877
-0.736
-7.66%
1 ene 1979 año
7.865
-1.012
-11.4%
1 ene 1980 año
9.275
+1.41
17.92%
1 ene 1981 año
11.33
+2.054
22.15%
1 ene 1982 año
11.811
+0.481
4.25%
1 ene 1983 año
9.708
-2.102
-17.8%
1 ene 1984 año
7.695
-2.013
-20.73%
1 ene 1985 año
6.817
-0.878
-11.41%
1 ene 1986 año
6.396
-0.421
-6.17%
1 ene 1987 año
3.959
-2.437
-38.1%
1 ene 1988 año
3.649
-0.311
-7.84%
1 ene 1989 año
2.935
-0.713
-19.55%
1 ene 1990 año
3.228
+0.293
9.97%
1 ene 1991 año
3.523
+0.295
9.13%
1 ene 1992 año
3.249
-0.274
-7.77%
1 ene 1993 año
2.976
-0.273
-8.4%
1 ene 1994 año
2.949
-0.027
-0.92%
1 ene 1995 año
2.55
-0.399
-13.51%
1 ene 1996 año
2.321
-0.229
-9.0%
1 ene 1997 año
2.512
+0.191
8.23%
1 ene 1998 año
2.449
-0.062
-2.49%
1 ene 1999 año
1.998
-0.452
-18.44%
1 ene 2000 año
2.123
+0.125
6.25%
1 ene 2001 año
2.864
+0.742
34.95%
1 ene 2002 año
2.62
-0.245
-8.54%
1 ene 2003 año
2.441
-0.178
-6.81%
1 ene 2004 año
2.416
-0.025
-1.03%
1 ene 2005 año
2.539
+0.123
5.09%
1 ene 2006 año
3.1
+0.561
22.08%
1 ene 2007 año
3.012
-0.088
-2.84%
1 ene 2008 año
2.71
-0.302
-10.01%
1 ene 2009 año
3.162
+0.451
16.65%
1 ene 2010 año
2.566
-0.596
-18.84%
1 ene 2011 año
2.637
+0.071
2.75%
1 ene 2012 año
2.689
+0.052
1.98%
1 ene 2013 año
3.159
+0.47
17.46%
1 ene 2014 año
3.01
-0.148
-4.69%
1 ene 2015 año
2.705
-0.306
-10.15%
Ranking de los países por los datos estadísticos actuales


Comentarios: