29
/es/
es
AIzaSyAYiBZKx7MnpbEhh9jyipgxe19OcubqV5w
April 1, 2024
244754
Somalia
SOM
true
2
1
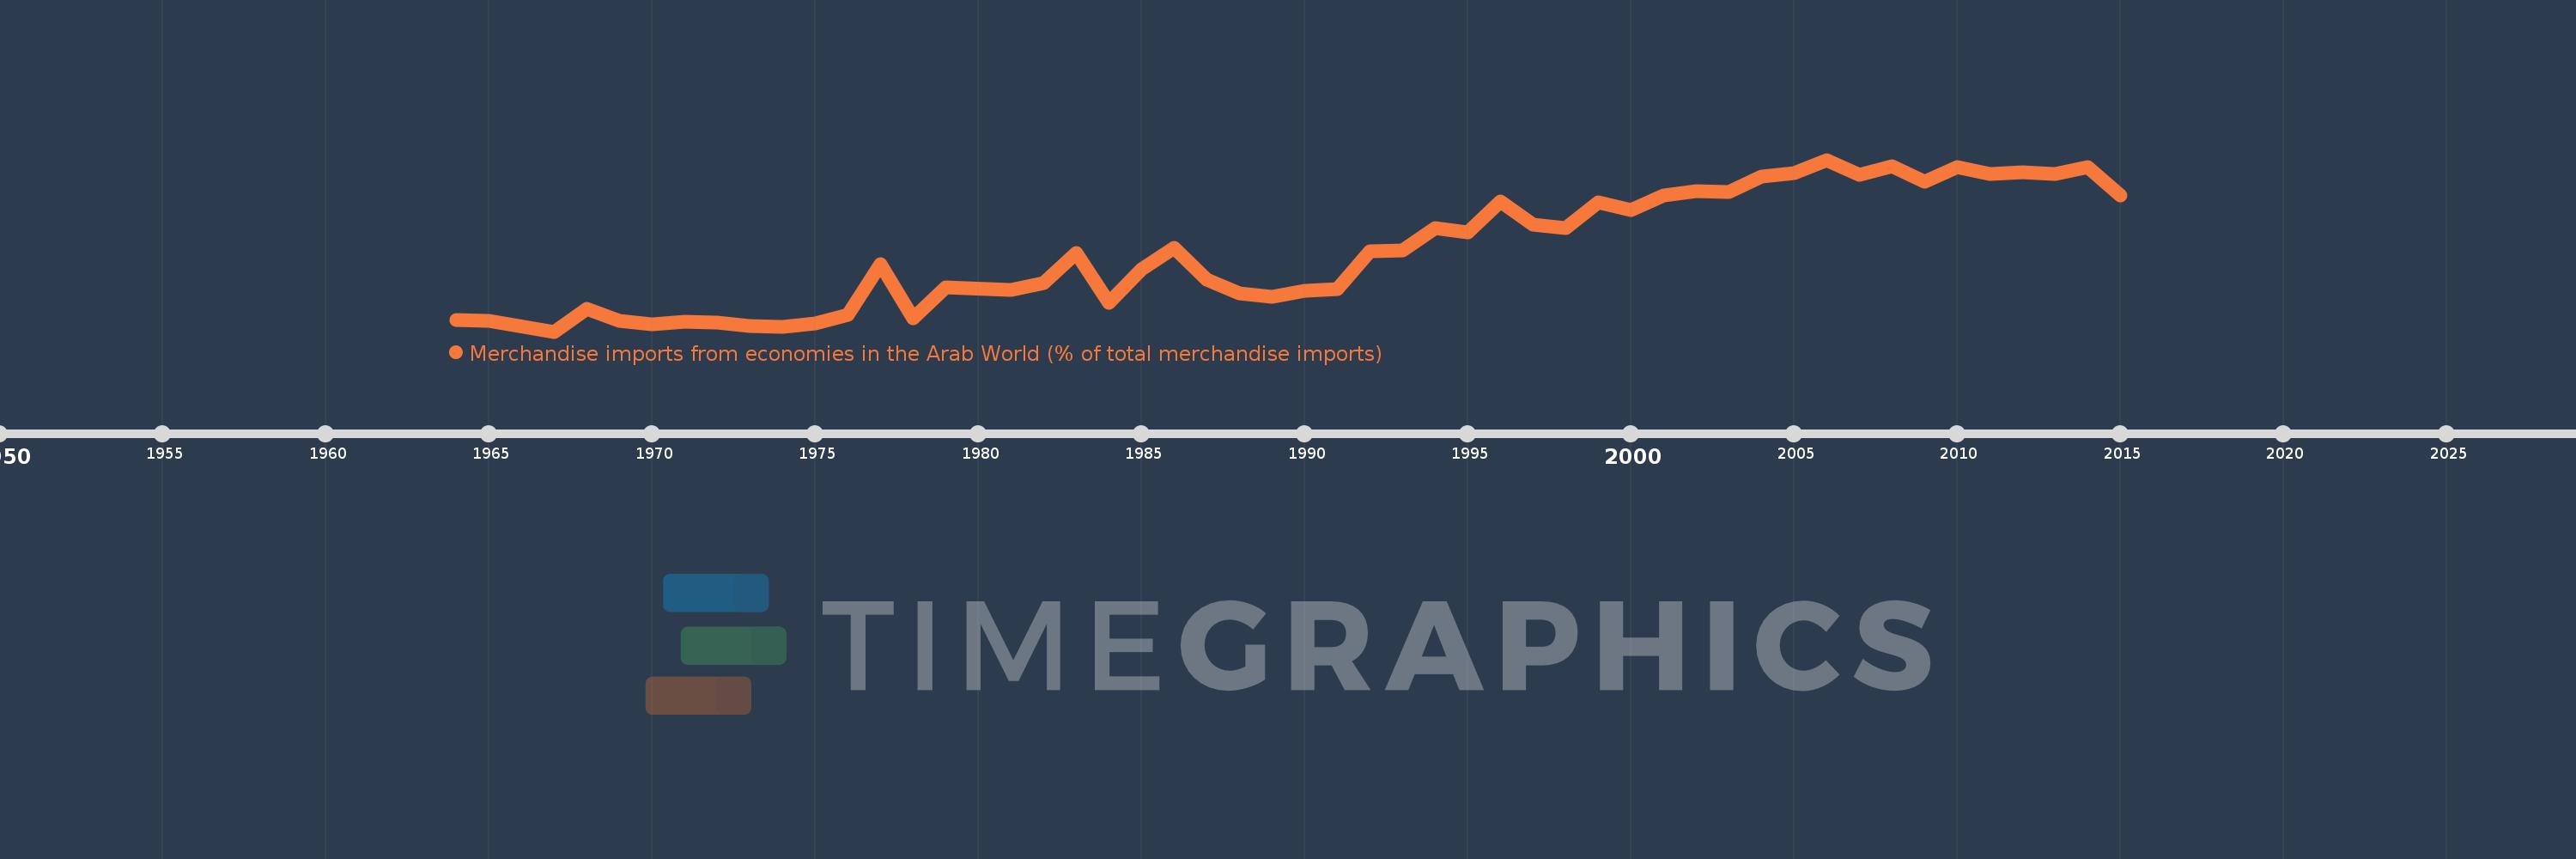
Merchandise imports from economies in the Arab World (% of total merchandise imports)
2015,2014,2013,2012,2011,2010,2009,2008,2007,2006,2005,2004,2003,2002,2001,2000,1999,1998,1997,1996,1995,1994,1993,1992,1991,1990,1989,1988,1987,1986,1985,1984,1983,1982,1981,1979,1978,1977,1976,1975,1974,1973,1972,1971,1970,1969,1968,1967,1965,1964
Estas estadísticas en otros países:
AfghanistanAlbaniaAlgeriaAngolaArab WorldArgentinaArmeniaArubaAustraliaAustriaAzerbaijanBahamas, TheBahrainBangladeshBarbadosBelarusBelgiumBelizeBeninBermudaBoliviaBrazilBrunei DarussalamBulgariaBurkina FasoBurundiCabo VerdeCambodiaCameroonCanadaCaribbean small statesCentral African RepublicCentral Europe and the BalticsChadChileChinaColombiaComorosCongo, Dem. Rep.Congo, Rep.Costa RicaCote d'IvoireCroatiaCubaCyprusCzech RepublicDenmarkDjiboutiDominicaDominican RepublicEarly-demographic dividendEast Asia & PacificEast Asia & Pacific (excluding high income)East Asia & Pacific (IDA & IBRD countries)EcuadorEgypt, Arab Rep.El SalvadorEstoniaEthiopiaEuro areaEurope & Central AsiaEurope & Central Asia (excluding high income)Europe & Central Asia (IDA & IBRD countries)European UnionFijiFinlandFragile and conflict affected situationsFranceFrench PolynesiaGabonGambia, TheGeorgiaGermanyGhanaGreeceGreenlandGrenadaGuatemalaGuineaGuinea-BissauGuyanaHaitiHeavily indebted poor countries (HIPC)High incomeHondurasHong Kong SAR, ChinaHungaryIBRD onlyIcelandIDA & IBRD totalIDA blendIDA onlyIDA totalIndiaIndonesiaIran, Islamic Rep.IraqIrelandItalyJamaicaJapanJordanKazakhstanKenyaKorea, Dem. People’s Rep.Korea, Rep.KuwaitKyrgyz RepublicLao PDRLate-demographic dividendLatin America & Caribbean Latin America & Caribbean (excluding high income)Latin America & the Caribbean (IDA & IBRD countries)LatviaLeast developed countries: UN classificationLebanonLiberiaLibyaLithuaniaLow & middle incomeLow incomeLower middle incomeLuxembourgMacao SAR, ChinaMacedonia, FYRMadagascarMalawiMalaysiaMaldivesMaliMaltaMauritaniaMauritiusMexicoMiddle East & North AfricaMiddle East & North Africa (excluding high income)Middle East & North Africa (IDA & IBRD countries)Middle incomeMoldovaMongoliaMontenegroMoroccoMozambiqueMyanmarNepalNetherlandsNew CaledoniaNew ZealandNicaraguaNigerNigeriaNorth AmericaNorwayOECD membersOmanOther small statesPacific island small statesPakistanPanamaPapua New GuineaParaguayPeruPhilippinesPolandPortugalPost-demographic dividendPre-demographic dividendQatarRomaniaRussian FederationRwandaSaudi ArabiaSenegalSerbiaSeychellesSierra LeoneSingaporeSlovak RepublicSloveniaSmall statesSomaliaSouth AfricaSouth AsiaSouth Asia (IDA & IBRD)SpainSri LankaSt. LuciaSt. Vincent and the GrenadinesSub-Saharan Africa Sub-Saharan Africa (excluding high income)Sub-Saharan Africa (IDA & IBRD countries)SudanSurinameSwedenSwitzerlandSyrian Arab RepublicTajikistanTanzaniaThailandTogoTrinidad and TobagoTunisiaTurkeyTurkmenistanUgandaUkraineUnited Arab EmiratesUnited KingdomUnited StatesUpper middle incomeUruguayVenezuela, RBVietnamWorldYemen, Rep.ZambiaZimbabwe línea de tiempo (timeline):
En esta escala de tiempo se presenta un gráfico de 1964 y 2015 de Somalia. Los datos de 1963 están ausentes. El número de observaciones reales por fecha: 50.
Fuente (nombre):
Indicadores del desarrollo mundial
Fuente (organización):
World Bank staff estimates based data from International Monetary Fund's Direction of Trade database.
Categorías:
Private Sector, Trade
Se ha actualizado:
23 abr 2017 año
Los indicadores de los cambios de valor en los últimos años
Máximo:
49.917
1 ene 2006 año
A la fecha de observación
Valor
Cambio absoluto
El cambio con respecto al valor anterior
1 ene 1964 año
3.363
+3.363
0.0%
1 ene 1965 año
3.154
-0.209
-6.22%
1 ene 1967 año
0.0
-3.154
-100.0%
1 ene 1968 año
6.536
+6.536
%
1 ene 1969 año
3.139
-3.397
-51.98%
1 ene 1970 año
2.196
-0.942
-30.02%
1 ene 1971 año
2.904
+0.708
32.24%
1 ene 1972 año
2.7
-0.204
-7.02%
1 ene 1973 año
1.667
-1.033
-38.26%
1 ene 1974 año
1.433
-0.234
-14.04%
1 ene 1975 año
2.282
+0.849
59.27%
1 ene 1976 año
4.784
+2.501
109.59%
1 ene 1977 año
19.591
+14.807
309.54%
1 ene 1978 año
3.928
-15.663
-79.95%
1 ene 1979 año
12.852
+8.923
227.14%
1 ene 1981 año
12.125
-0.726
-5.65%
1 ene 1982 año
14.063
+1.938
15.98%
1 ene 1983 año
22.843
+8.78
62.43%
1 ene 1984 año
8.353
-14.491
-63.44%
1 ene 1985 año
18.015
+9.662
115.68%
1 ene 1986 año
24.311
+6.296
34.95%
1 ene 1987 año
15.184
-9.127
-37.54%
1 ene 1988 año
11.074
-4.11
-27.07%
1 ene 1989 año
10.127
-0.947
-8.55%
1 ene 1990 año
11.937
+1.81
17.88%
1 ene 1991 año
12.317
+0.38
3.18%
1 ene 1992 año
23.327
+11.009
89.38%
1 ene 1993 año
23.615
+0.289
1.24%
1 ene 1994 año
30.025
+6.41
27.14%
1 ene 1995 año
28.923
-1.102
-3.67%
1 ene 1996 año
37.842
+8.919
30.84%
1 ene 1997 año
31.076
-6.766
-17.88%
1 ene 1998 año
30.152
-0.925
-2.98%
1 ene 1999 año
37.495
+7.343
24.35%
1 ene 2000 año
35.295
-2.2
-5.87%
1 ene 2001 año
39.508
+4.213
11.94%
1 ene 2002 año
40.765
+1.258
3.18%
1 ene 2003 año
40.462
-0.304
-0.75%
1 ene 2004 año
45.112
+4.65
11.49%
1 ene 2005 año
46.117
+1.005
2.23%
1 ene 2006 año
49.917
+3.8
8.24%
1 ene 2007 año
45.637
-4.279
-8.57%
1 ene 2008 año
48.099
+2.462
5.4%
1 ene 2009 año
43.644
-4.456
-9.26%
1 ene 2010 año
47.844
+4.201
9.62%
1 ene 2011 año
45.819
-2.025
-4.23%
1 ene 2012 año
46.184
+0.366
0.8%
1 ene 2013 año
45.708
-0.476
-1.03%
1 ene 2014 año
47.822
+2.114
4.62%
1 ene 2015 año
39.635
-8.187
-17.12%
Ranking de los países por los datos estadísticos actuales


Comentarios: