29
/es/
es
AIzaSyAYiBZKx7MnpbEhh9jyipgxe19OcubqV5w
April 1, 2024
226168
Portugal
PRT
true
2
1
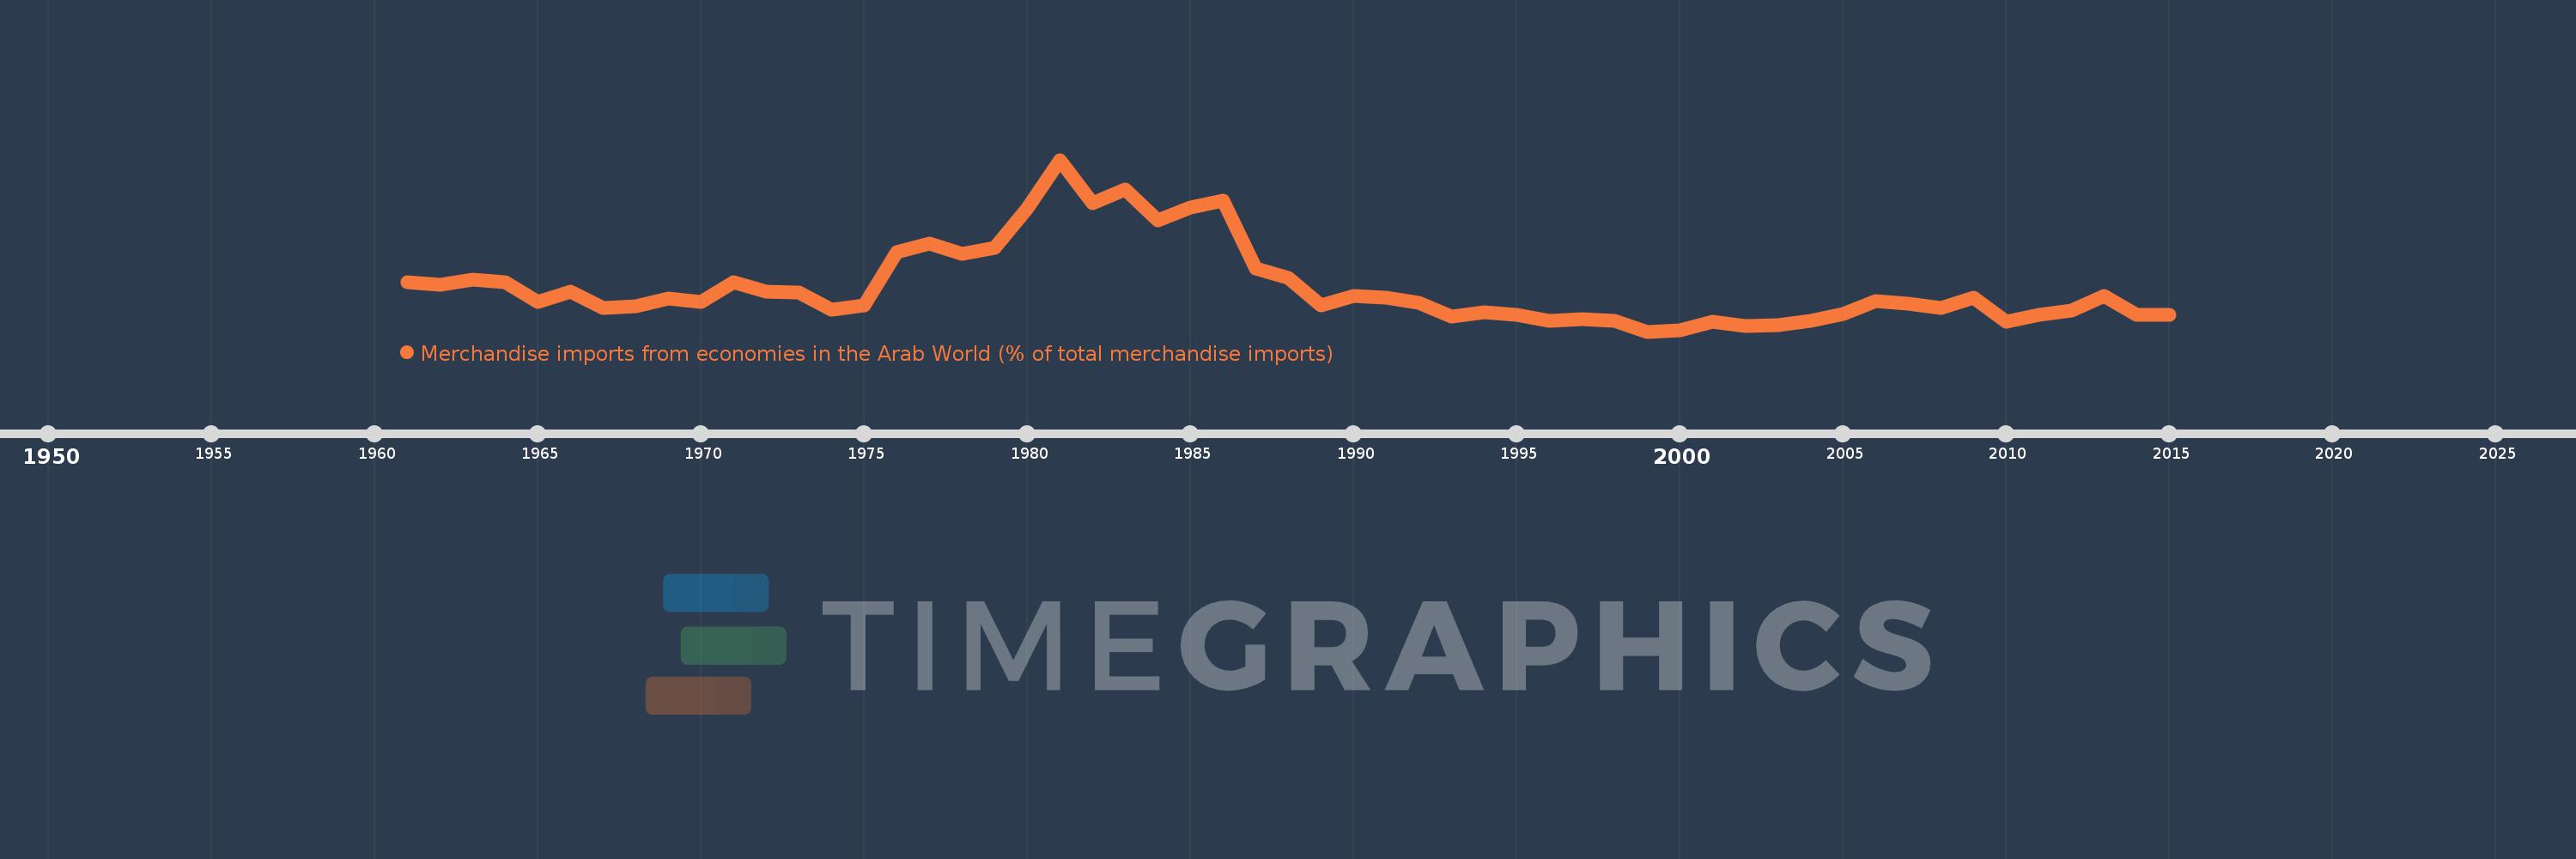
Merchandise imports from economies in the Arab World (% of total merchandise imports)
2015,2014,2013,2012,2011,2010,2009,2008,2007,2006,2005,2004,2003,2002,2001,2000,1999,1998,1997,1996,1995,1994,1993,1992,1991,1990,1989,1988,1987,1986,1985,1984,1983,1982,1981,1980,1979,1978,1977,1976,1975,1974,1973,1972,1971,1970,1969,1968,1967,1966,1965,1964,1963,1962,1961
Estas estadísticas en otros países:
AfghanistanAlbaniaAlgeriaAngolaArab WorldArgentinaArmeniaArubaAustraliaAustriaAzerbaijanBahamas, TheBahrainBangladeshBarbadosBelarusBelgiumBelizeBeninBermudaBoliviaBrazilBrunei DarussalamBulgariaBurkina FasoBurundiCabo VerdeCambodiaCameroonCanadaCaribbean small statesCentral African RepublicCentral Europe and the BalticsChadChileChinaColombiaComorosCongo, Dem. Rep.Congo, Rep.Costa RicaCote d'IvoireCroatiaCubaCyprusCzech RepublicDenmarkDjiboutiDominicaDominican RepublicEarly-demographic dividendEast Asia & PacificEast Asia & Pacific (excluding high income)East Asia & Pacific (IDA & IBRD countries)EcuadorEgypt, Arab Rep.El SalvadorEstoniaEthiopiaEuro areaEurope & Central AsiaEurope & Central Asia (excluding high income)Europe & Central Asia (IDA & IBRD countries)European UnionFijiFinlandFragile and conflict affected situationsFranceFrench PolynesiaGabonGambia, TheGeorgiaGermanyGhanaGreeceGreenlandGrenadaGuatemalaGuineaGuinea-BissauGuyanaHaitiHeavily indebted poor countries (HIPC)High incomeHondurasHong Kong SAR, ChinaHungaryIBRD onlyIcelandIDA & IBRD totalIDA blendIDA onlyIDA totalIndiaIndonesiaIran, Islamic Rep.IraqIrelandItalyJamaicaJapanJordanKazakhstanKenyaKorea, Dem. People’s Rep.Korea, Rep.KuwaitKyrgyz RepublicLao PDRLate-demographic dividendLatin America & Caribbean Latin America & Caribbean (excluding high income)Latin America & the Caribbean (IDA & IBRD countries)LatviaLeast developed countries: UN classificationLebanonLiberiaLibyaLithuaniaLow & middle incomeLow incomeLower middle incomeLuxembourgMacao SAR, ChinaMacedonia, FYRMadagascarMalawiMalaysiaMaldivesMaliMaltaMauritaniaMauritiusMexicoMiddle East & North AfricaMiddle East & North Africa (excluding high income)Middle East & North Africa (IDA & IBRD countries)Middle incomeMoldovaMongoliaMontenegroMoroccoMozambiqueMyanmarNepalNetherlandsNew CaledoniaNew ZealandNicaraguaNigerNigeriaNorth AmericaNorwayOECD membersOmanOther small statesPacific island small statesPakistanPanamaPapua New GuineaParaguayPeruPhilippinesPolandPortugalPost-demographic dividendPre-demographic dividendQatarRomaniaRussian FederationRwandaSaudi ArabiaSenegalSerbiaSeychellesSierra LeoneSingaporeSlovak RepublicSloveniaSmall statesSomaliaSouth AfricaSouth AsiaSouth Asia (IDA & IBRD)SpainSri LankaSt. LuciaSt. Vincent and the GrenadinesSub-Saharan Africa Sub-Saharan Africa (excluding high income)Sub-Saharan Africa (IDA & IBRD countries)SudanSurinameSwedenSwitzerlandSyrian Arab RepublicTajikistanTanzaniaThailandTogoTrinidad and TobagoTunisiaTurkeyTurkmenistanUgandaUkraineUnited Arab EmiratesUnited KingdomUnited StatesUpper middle incomeUruguayVenezuela, RBVietnamWorldYemen, Rep.ZambiaZimbabwe línea de tiempo (timeline):
En esta escala de tiempo se presenta un gráfico de 1961 y 2015 de Portugal. Los datos de 1960 están ausentes. El número de observaciones reales por fecha: 55.
Fuente (nombre):
Indicadores del desarrollo mundial
Fuente (organización):
World Bank staff estimates based data from International Monetary Fund's Direction of Trade database.
Categorías:
Private Sector, Trade
Se ha actualizado:
23 abr 2017 año
Los indicadores de los cambios de valor en los últimos años
Mínimo:
1.854
1 ene 1999 año
Máximo:
16.659
1 ene 1981 año
A la fecha de observación
Valor
Cambio absoluto
El cambio con respecto al valor anterior
1 ene 1961 año
6.098
+6.098
0.0%
1 ene 1962 año
5.876
-0.222
-3.64%
1 ene 1963 año
6.312
+0.436
7.41%
1 ene 1964 año
6.115
-0.197
-3.12%
1 ene 1965 año
4.417
-1.697
-27.76%
1 ene 1966 año
5.285
+0.868
19.66%
1 ene 1967 año
3.87
-1.416
-26.78%
1 ene 1968 año
4.027
+0.157
4.07%
1 ene 1969 año
4.714
+0.686
17.05%
1 ene 1970 año
4.422
-0.292
-6.19%
1 ene 1971 año
6.129
+1.708
38.62%
1 ene 1972 año
5.273
-0.857
-13.98%
1 ene 1973 año
5.237
-0.036
-0.68%
1 ene 1974 año
3.76
-1.477
-28.21%
1 ene 1975 año
4.136
+0.377
10.02%
1 ene 1976 año
8.735
+4.599
111.19%
1 ene 1977 año
9.425
+0.689
7.89%
1 ene 1978 año
8.587
-0.838
-8.89%
1 ene 1979 año
9.07
+0.484
5.64%
1 ene 1980 año
12.456
+3.386
37.33%
1 ene 1981 año
16.659
+4.202
33.74%
1 ene 1982 año
12.939
-3.72
-22.33%
1 ene 1983 año
14.091
+1.152
8.91%
1 ene 1984 año
11.432
-2.659
-18.87%
1 ene 1985 año
12.573
+1.14
9.97%
1 ene 1986 año
13.124
+0.552
4.39%
1 ene 1987 año
7.324
-5.8
-44.19%
1 ene 1988 año
6.473
-0.851
-11.62%
1 ene 1989 año
4.121
-2.352
-36.34%
1 ene 1990 año
4.901
+0.78
18.93%
1 ene 1991 año
4.797
-0.104
-2.11%
1 ene 1992 año
4.369
-0.429
-8.93%
1 ene 1993 año
3.129
-1.239
-28.37%
1 ene 1994 año
3.522
+0.393
12.57%
1 ene 1995 año
3.308
-0.214
-6.08%
1 ene 1996 año
2.795
-0.513
-15.5%
1 ene 1997 año
2.895
+0.1
3.57%
1 ene 1998 año
2.794
-0.101
-3.5%
1 ene 1999 año
1.854
-0.94
-33.65%
1 ene 2000 año
1.956
+0.102
5.52%
1 ene 2001 año
2.679
+0.723
36.99%
1 ene 2002 año
2.314
-0.366
-13.65%
1 ene 2003 año
2.373
+0.059
2.57%
1 ene 2004 año
2.775
+0.402
16.94%
1 ene 2005 año
3.37
+0.595
21.44%
1 ene 2006 año
4.468
+1.098
32.58%
1 ene 2007 año
4.291
-0.178
-3.97%
1 ene 2008 año
3.869
-0.422
-9.83%
1 ene 2009 año
4.79
+0.921
23.82%
1 ene 2010 año
2.687
-2.103
-43.9%
1 ene 2011 año
3.283
+0.596
22.18%
1 ene 2012 año
3.649
+0.366
11.15%
1 ene 2013 año
4.941
+1.292
35.4%
1 ene 2014 año
3.315
-1.626
-32.9%
1 ene 2015 año
3.318
+0.003
0.09%
Ranking de los países por los datos estadísticos actuales


Comentarios: